SharePoint Gantt Charts Made Easy - April 7, 2025
Introduction to Gantt Charts
Gantt Charts have long been a staple tool in project management, providing a visual timeline that maps out project schedules and dependencies. Their structure allows for detailed tracking of project progress, making it easy to understand and align tasks with timelines. Gantt Charts illustrate the start and end dates of project elements, presenting a clear picture that aids in effective project planning and resource allocation.
Integration with SharePoint
Incorporating Gantt Charts into platforms like SharePoint can significantly boost your project management capabilities. SharePoint, renowned for its collaborative and project management features, becomes even more powerful when Gantt Charts are added. These charts offer a streamlined, visually engaging way to display project progress, making it easier for team members to stay informed and organized as they navigate their roles and responsibilities.
Enhancing Chart Appearance with Color Coding
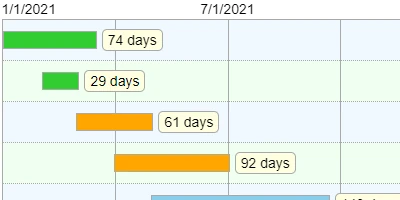
Introducing color coding into Gantt Charts can help differentiate between various project statuses or categories. For instance, a green bar might indicate 'on track' tasks, while red might signal delays or critical issues needing immediate attention. Color encoding simplifies the interpretation of the chart as stakeholders can quickly assess the overall health and progress of each project. This enhances the visual appeal and communicative power of Gantt Charts, making them an even more effective tool for project management.
The Role of Gantt Charts in Project Management
Gantt Charts play a critical role in project management by enabling project managers to visually coordinate project tasks, manage resources, and track team performance. They provide a broad yet detailed overview of all project activities, helping managers identify overlap between multiple projects and resource allocation conflicts. This comprehensive view aids in the strategic planning of tasks, allowing for a more organized and effective project lifecycle.
Visual Status Indicators
In addition to color coding, Gantt Charts use visual indicators to reflect project statuses. Simple markers or icons can denote milestones, deadlines, and critical paths, adding another layer of clarity. These indicators help team members and stakeholders quickly identify the progress against predefined benchmarks and make necessary adjustments, fostering a proactive approach to project management.
Employee Management and Tracking
Gantt Charts not only offer insights into the project itself but also into team performance. By associating tasks with individual team members, these charts can help managers assess workload distribution and identify team members who may be over-allocated or under-utilized. This capability makes Gantt Charts an essential tool for human resource management within projects, ensuring that every team member's workload is balanced and manageable.
Use Case Scenarios
To illustrate the practical advantages of Gantt Charts, consider the following scenarios:
Scenario 1: Construction Project
In a large-scale construction project involving multiple contractors and subcontractors, coordinating schedules is crucial. A Gantt Chart provides a coordinated schedule, allowing project managers to track each phase of the project individually while still observing the overall timeline. Utilizing SharePoint to house this Gantt Chart ensures that all contractors can access live updates, facilitating real-time collaboration and efficient reallocation of resources as needed.
Scenario 2: Software Development
In software development, projects can be complex with various stages like planning, design, coding, testing, and deployment running concurrently. A Gantt Chart clarifies these interdependencies and timelines, helping the development team and stakeholders to monitor deadlines and milestones. It assists managers in allocating the right resources at different stages, ensuring smooth progress from one phase to another without bottlenecks.
Scenario 3: Event Planning
An event planning team can benefit greatly from Gantt Charts to organize logistics, marketing, and registration for an event. By visualizing the timeline, the team ensures that all tasks such as venue booking, invitations, and promotions are completed on schedule. With SharePoint integration, the team members can communicate seamlessly, sharing live updates within the Gantt Chart to manage last-minute changes effectively.
Conclusion
Incorporating Gantt Charts into project management via platforms like SharePoint can substantially strengthen the ability to manage complex projects. The visual clarity and ease of understanding they provide help teams collaborate more effectively, ensuring all parties are aligned toward the same goals. With the enhancements of color coding and visual status indicators, Gantt Charts become even more powerful, acting as a central tool for tracking progress, managing resources, and driving project success. Whether for construction, software development, or event planning, Gantt Charts are invaluable for visualizing and navigating the intricacies of modern project management.
|
