Show Date Countdown Indicator in SharePoint Lists - April 20, 2025
Introduction to Project Management and Visual Tracking
Effectively managing tasks and deadlines is a fundamental aspect of successful project management. Tracking project progress, managing employee tasks, and maintaining an overview of deadlines can be overwhelming without the right tools. One effective method to achieve this is to use charting and visual status indicators. These tools offer a clear, intuitive way to track important metrics, such as the number of days remaining until a task's due date.
Utilizing KPIs in SharePoint
SharePoint, a collaboration platform that integrates seamlessly with Microsoft Office, provides a powerful environment for project management. It allows users to create and manage lists that track a wide variety of metrics. By utilizing Key Performance Indicators (KPIs), project managers can visualize the progression of tasks, helping to ensure deadlines are met. One popular KPI is the Til Due indicator, which shows the number of days left before tasks are due.
Setting Up SharePoint Dashboards
One can easily set up a SharePoint dashboard to include the Til Due KPI indicator using templates from SharePointDashboards.com. This process requires no custom coding or complex setup. Instead, users simply apply settings to control the aesthetic aspects and functionality of the template, and then copy and paste the pre-defined code into your SharePoint list. This process is not only fast and efficient but also adds a visually appealing and highly functional element to your dashboard.
The Importance of Visual Status Indicators
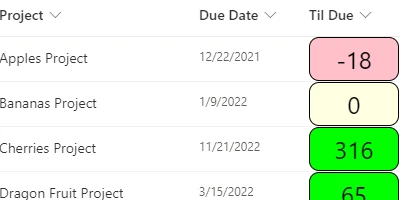
Visual status indicators, such as color coding, play a crucial role in interpreting data at a glance. The Til Due KPI uses color codes to indicate whether a due date is in the future, today, or has already passed:
- Future dates might be marked with green, signaling the project is on track.
- A yellow indication might represent due dates that are today, drawing attention to immediate tasks.
- Red colors typically signify overdue tasks and require urgent attention.
This instant visual feedback helps teams prioritize their workloads effectively and enhances overall productivity.
Charting and Data Visualization in SharePoint
Data visualization through tools like charts and graphs makes it easier for project managers to grasp complex datasets quickly. In SharePoint, using KPIs like the Til Due indicator can enhance this visual representation of data, reinforcing team focus and alignment. Such indicators can be pivotal during meetings as they provide a concise overview of upcoming deadlines and past performance, fostering discussions on project timelines and workload distribution.
Implementing SharePoint JSON Formatting
For those looking to customize further, SharePoint supports JSON formatting, allowing users to apply tailored templates to list views. By embedding the Til Due KPI indicator into a list view, users gain the ability to manipulate and present their data in a more digestible format. JSON formatting simplifies data representation and allows for achieving a polished look that can be adapted to any corporate style or brand guideline.
Benefits of Tracking Deadlines Effectively
Monitoring the timelines of tasks not only aids in meeting deadlines but also supports broader project management objectives, such as resource allocation, employee time management, and predictive workload assessment. It is equally beneficial for:
- Managers, who can quickly assess project status and reassign resources if necessary.
- Employees, who can prioritize their activities and manage their time effectively.
- Stakeholders, who gain confidence in the project team's ability to meet deadlines consistently.
Use Case Scenarios
Imagine managing a marketing campaign with multiple deliverables due every week. Without clear insight into approaching deadlines, some tasks may inadvertently fall behind. Implementing the Til Due KPI allows campaign managers to track task deadlines effectively, ensuring a steady content rollout and deadline adherence.
Similarly, in a software development project, multiple modules may be at different stages with varied deadlines. By applying this KPI, project managers can visualize the timeline for each module, keeping the development team aligned with project goals and timelines.
Conclusion
The Til Due KPI indicator from SharePointDashboards.com represents a versatile and practical addition to any SharePoint list. It empowers users to manage their tasks efficiently, ensuring deadlines are consistently met. Through simple setup and powerful visualization capabilities, this tool fits seamlessly into the larger framework of charting and project management strategies. As businesses continue to navigate increasingly complex projects, tools like this offer a valuable means to maintain control and direction in a dynamic environment.
|
