Understanding Waterfall Charts
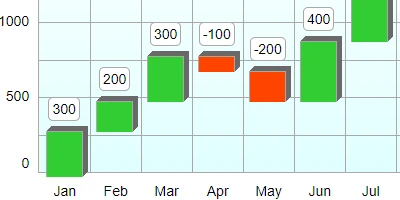
Waterfall charts are a unique form of bar chart that provide significant insights into data, particularly when analyzing changes over time. Unlike standard bar charts, waterfall charts demonstrate how an initial value is affected by subsequent positive or negative values, thus revealing the cumulative effect across a sequence. This makes waterfall charts valuable for various applications within project and employee management systems.
Waterfall Charts in Charting and Visual Status Indicators
Waterfall charts are particularly effective in charting and creating visual status indicators due to their ability to clearly depict how each segment of the data contributes to the overall total. By visualizing the progression and regression of certain metrics, these charts allow managers and stakeholders to gain an immediate understanding of trends and variances over a defined period, such as the 12 months of a year.
The visualization capabilities of waterfall charts make them indispensable tools in project management. They allow teams to track both accumulative and individual impacts of sequential tasks and milestones. This application provides a transparent overview of the project's status, highlighting areas of concern or success without extensive data analysis.
Integration with Project Management
Incorporating waterfall charts into project management workflows can significantly enhance oversight capabilities. For instance, these charts can be used to display budget fluctuations over time, connecting financial projections with real-time spending. This enables teams to monitor expenses closely, identify budget overruns, or underspend, and take timely corrective actions. Similarly, waterfall charts can be used to track the progression of project timelines, showing anticipated vs. actual completion dates, thereby allowing for precise project adjustments when necessary.
In terms of employee management and tracking, waterfall charts serve to identify individual contributions to larger team objectives. By breaking down performance indicators into components, managers can better assess employee performance and identify areas requiring development or recognition.
Setting Up Waterfall Charts in SharePoint
Creating waterfall charts in SharePoint has been simplified with templates available from
SharePointDashboards.com. Users can customize the settings to align the chart's appearance with organizational branding and specific analytical needs. The prepared template can be easily integrated into a SharePoint list by copying and pasting the chart configuration.
Use Cases: Demonstrating Status and Progress
Several scenarios illustrate the utility of waterfall charts in enhancing status visualization and progress tracking:
- Financial Reporting: Organizations can use waterfall charts to portray quarterly financial results, highlighting the factors contributing to net profit or loss.
- Sales Funnels: This chart type can break down each stage of a sales funnel, showing where potential deals are gained or lost.
- Inventory Management: Waterfall charts effectively track inventory levels over time, illustrating replenishment and depletion patterns.
- Resource Allocation: Within project management, resources can be allocated efficiently by visualizing capacity versus utilization across time points.
SharePoint JSON Formatting
JSON formatting plays a critical role in rendering waterfall charts on SharePoint. By applying a predefined template to a SharePoint list view, users can seamlessly integrate these charts into existing data infrastructures. JSON formatting allows for the customization of visual elements, such as colors and labels, to ensure that the chart not only fits organizational requirements but also remains user-friendly and visually appealing.
Conclusion
Waterfall charts are robust tools for data visualization, offering clear and comprehensive insights into data trends over time. Their integration into SharePoint, particularly through customizable templates from
SharePointDashboards.com, provides organizations with powerful resources for enhancing their project and employee management processes. By leveraging the unique characteristics of waterfall charts, organizations can improve decision-making processes and maintain a clear view of their key performance metrics. With the assistance of tutorials and access to multiple charting options, adapting this tool for organizational needs becomes an effortless endeavor.