Set up Custom Form Cards in SharePointSet up your own custom form cards in SharePoint using the Custom Cards Template at SharepointDashboards.com. A sophisticated custom card template that allows for edit form capabilities using inline edit mode. Fields can span multiple columns by prefixing the column name with "#CW" where # is an integer value. E.g. a field named Status could be changed to two columns by using the name "2CWStatus". This can be helpful for fields that contain more information such as multiline text. There are some special rules to consider when using inline edit mode. The Image field type and calculated field types are not editable from the card. Multiline text fields are only editable if using simple text mode (not rich text editing). Use the "Close Redirect" URL to provide a link back to a standard list view for users that are editing the card. It is recommended to redirect to the "All Items" default list view. The Edit button is useful when not using inline edit and prefer the standard side panel edit form instead. Use this template in combination with the Card Link Template in order to move back and forth between a list view and the card view. |
June 4, 2026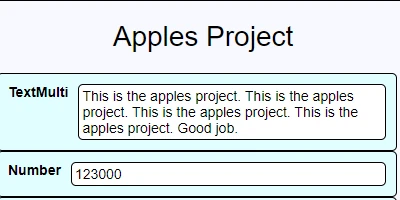
|
Funnel Chart for SharePoint ListsA funnel chart is designed to show progressive reduction through a sequence of stages. It is especially useful when you want to visualize how many items successfully move from one step to the next and where losses or drop-offs occur. The classic example is a sales pipeline: New Leads, Qualified Leads, Proposal Sent, Negotiation, Closed Deals Each stage narrows, creating the visual "funnel" shape. This chart can be set up easily using SharePointDashboards.com and the Funnel Chart Template. Control the look of the chart using several options to adjust colors, text and dimensions to fit your exact situation. Best of all, these charts can be shared with anyone throughout your organization without requiring additional licenses as is the case with Power BI. New users can sign up for free to get access to 21 free templates. |
June 3, 2026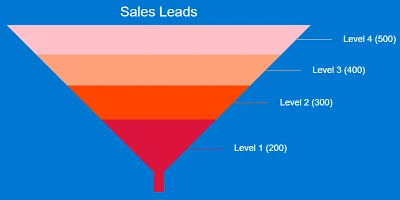
|
Pyramid Chart for SharePoint ListsA pyramid chart is a way to visualize data that is divided into hierarchical or proportional layers, usually stacked from largest at the bottom to smallest at the top. It is often used to show how quantities narrow as you move upward through stages, categories, or organizational levels. A funnel chart is closely related, but the emphasis is slightly different. A pyramid chart emphasizes relative size or hierarchy. This chart is easy to set up using the Pyramid Chart Template at SharePointDashbaords.com. Set up take just a few minutes and requires only a small amount of fields to be set up. SharePointDashboards.com includes a tutorial which shows exactly how to set up this chart. |
June 2, 2026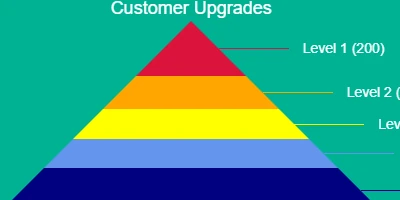
|
Picture Slideshow for SharePointIt should be simple to set up a basic picture slideshow in SharePoint. Using SharePointDashboards.com that process IS easy. The process of creating your own custom picture slideshow requires just a few steps. Set up your list of slides, set the order using the index column then adjust the look and feel of your slideshow using the settings for the template at SharePointDashboards.com. This template is one of nine different image based templates which makes displaying libraries of image easy and friendly for users. If you are storing libraries of images in SharePoint that you want to be easy to browse and share, these templates will make sharing with users much easier to handle. When it comes to making images look nice in SharePoint, SharePointDashboards.com has you covered. |
June 1, 2026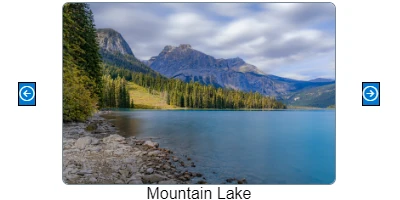
|
Marimekko Chart for SharePoint ListsThe Marimekko Chart for SharePoint from SharePointDashboards.com is one of the more interesting and dynamic charts that can be used in SharePoint lists. A Marimekko chart, sometimes called a Mekko chart, is basically a hybrid of a stacked bar chart and a bubble chart. What makes it interesting is that it shows two dimensions of magnitude at the same time: The width of each column represents one variable. The height of the segments inside the column represents percentages or composition. The overall area of each block represents total contribution. That gives you a way to visualize market structure, portfolio makeup, resource allocation, or category dominance in a single view. A full tutorial is provided to help you get this chart set up in minutes. |
May 31, 2026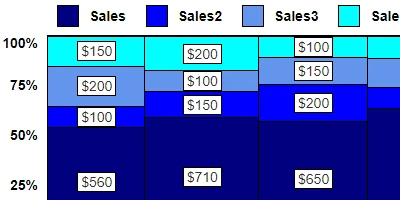
|
SharePoint Combo Button Makes Every SharePoint List BetterThe SharePoint Combo Button makes SharePoint lists easier to use by making the most common list record operations available in one click. Edit, View and Delete options open in a focused menu when clicking the button. No more wading through long menus of options or searching around in the command bar. Setting up this template is easy to do and only requires a few steps. Simply set up a column to hold the button then copy and paste the template from SharePointDashboards.com. This template is easy to reuse across nearly any SharePoint list. Make life easier for your users by adding this button to your lists today. This template is available along hundreds of other templates at SharePointDashboards.com. In fact this is one of more than 34 different button templates available. |
May 30, 2026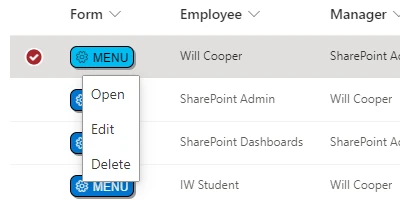
|
Build Visual Bar Charts Using Icons in SharePointThe Pictogram Chart at SharePointDashboards.com allows you to visualize values with just about any kind of icons that you can think of. This chart is incredibly easy to use. I requires only 3 fields: A label field, a number field and icon field for each SharePoint list record. Every part of the the chart can be adjusted including scale, colors, borders and spacing. Using this chart system it is possible to create charts that can be shared through your organization without the large expenses required with Power BI. This charting template is one of more than 36 different charting templates available at SharePointDashboards.com. Just about any kind of chart can be produce using SharePointDashboards.com templates. This is just one of many kinds of bar charts templates available to use. |
May 29, 2026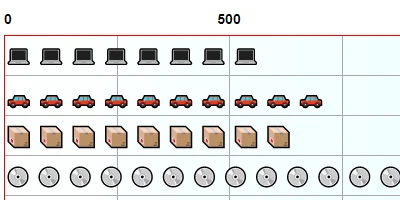
|
Add YouTube Video Card Links in SharePointLink to helpful YouTube videos from SharePoint easily with this simple formatting template. Video preview tiles are shown for each video. This template is easy to set up requiring only a YouTube Video ID and Title for the video. Control the look and feel of the video cards easily using the visual settings at SharePointDashboards.com. Configuration options include border, background, font styling and other options. This is a easy way to bring YouTube and SharePoint together with minimal effort. Your users need to do nothing more than click on the video tile to jump right to watching the YouTube video. This is a must have template for any organization that makes use of YouTube videos for training or other company updates. |
May 28, 2026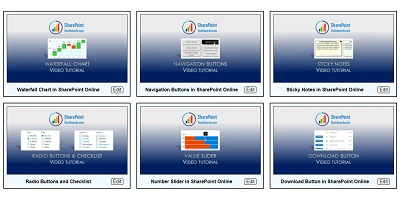
|
Add a Waterfall Chart to your SharePoint siteA waterfall chart is a special kind of bar chart which has unique characteristics. This is a variation on a standard bar chart. The waterfall chart template is available to download from SharePointDashboards.com. Enter your settings to control the look and feel of your chart then copy and paste the chart directly to your SharePoint list. This kind of chart is especially useful when looking at a time range using the 12 months in the year as an example. This help to visualize the progress over time from month to month. Learning how to use the chart is easy. Just follow along with the provided tutorial video which demonstrates applying the chart in SharePoint. This chart is one of more than 35 different charting options available at SharePoint Dashboards.com. New users can sign up to get access to 21 free templates. |
July 1, 2025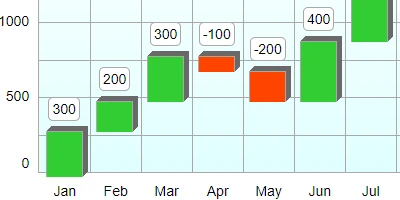
|
Add a custom button navigation grid to your SharePoint siteNavigation is essential in SharePoint sites. The most appealing user friendly way to provide navigation is through the use of buttons. The Button Navigation template at SharePointDashboards.com is the simple fast setup method to add navigation buttons to your SharePoint site. Configure the look and feel of your navigation button however you like. Adjust the font color, background color, hover color and text styling using dropdown options and color pickers. Applying the template is easy. Just copy and paste the template directly from the SharePoint Dashboards site directly to your SharePoint site. No app installation is required. New users can sign up to access 21 free templates. Providing a button style navigation is easy with the help of SharePointDashboards.com. There are many other navigation templates also available at SharePoint Dashboards. |
June 30, 2025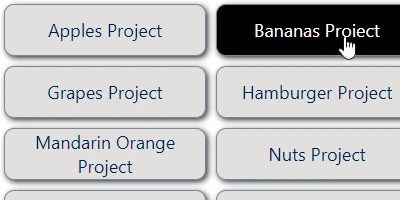
|
Add Sticky Notes to your SharePoint siteEveryone uses sticky notes. This is an easy way to remind ourselves about required tasks. Using the Sticky Notes template at SharePoint Dashboards, you can turn your SharePoint list into an interactive board for sticky notes. The look of your sticky notes board is completely configurable. Users can add or update sticky notes easily using the SharePoint list view. Sticky notes even match the colors used in actual sticky notes. If you like the idea of a reminder board that looks like the sticky notes you use every day at your desk, then you will love this template. Setting up this template is easy. Choose your preferred look and feel options then copy and paste the template directly to your SharePoint site. New users can sign up to get 21 free templates at SharePointDashboards.com. This is one of hundreds of templates available. |
June 29, 2025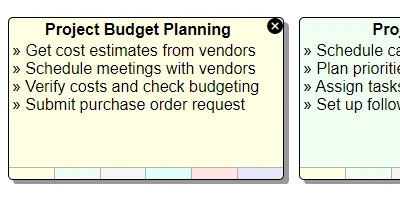
|
Add a Checklist Input field to your SharePoint ListChecklists are a common interface for task management in SharePoint. Using the Checklist Template at SharePointDashboards.com you can turn a multiselect choice field into an interactive checklist. This template allows users to make updates directly from the SharePoint list view. The look and feel of this input field is completely configurable at the SharePoint Dashboards website. Setup is easy. Adjust your settings then copy and paste the template directly your SharePoint choice field. No installation is required in your SharePoint site. This is a great way to speed up updates since it will no longer be necessary to open up the SharePoint form each time that you need to make an update. New users can sign up to get 21 free templates. This is one of hundreds of templates available at the SharePoint Dashboards site. |
June 28, 2025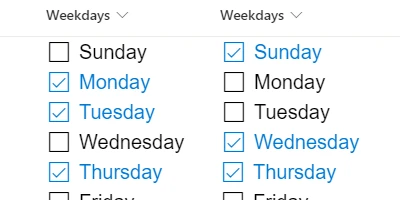
|
Add a Radio Buttons input to your SharePoint ListRadio buttons are a useful input for choice fields. Using the template for a choice field allows users to see all possible choices at once. This column formatting template allows users to make updates directly from the SharePoint list view instead of opening the form. This save time and allows more efficient list updates. The radio buttons can be styled to look exactly how you prefer including options for colors, border and size. Setting up this template is easy. Just adjust your settings at SharePointDashboards.com then copy and paste the template directly to your SharePoint choice columns. This is one of hundreds of templates available at SharePointDashboards.com. New users can sign up to get access to 21 free templates. Explore all the options available to make your SharePoint lists look amazing. |
June 27, 2025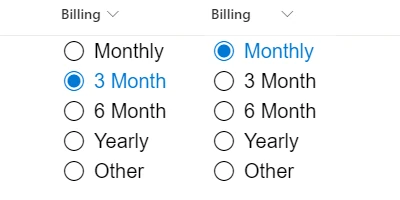
|
Add a number slider input to your SharePoint listsNumber fields are used all the time in SharePoint lists. When setting a value in a range, a number slider control is the perfect way to improve user input. With a number slider control, the user can incrementally adjust a value up or down in set increments. The visual indicator shows the value in an eye catching way similar to a bar chart. Normally number field are not interactive. By applying this template, your users will see a visual indication of the value and also be able to easily adjust values up or down directly in the SharePoint list view. This is an easy interface that make the list more dynamic. Applying the template is simple. Just copy and paste the template directly from SharePointDashboards.com. This input template is one of hundreds of templates available at SharePointDashboards.com. Get started with 21 templates for free. |
June 26, 2025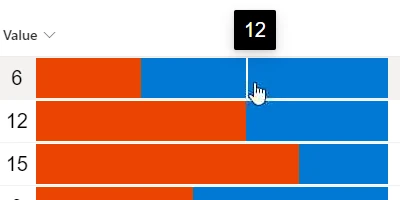
|
Download Button for SharePoint LibrariesSharePoint libraries are essential in SharePoint. The most common use of SharePoint is to share files in central libraries in SharePoint. An easy way to make SharePoint libraries more user friendly is to add a download button which appears next to each file in each SharePoint library. This functionality makes it possible for users to get files that they need with just one click. Setting up this template is easy. Just copy and paste the template from SharePointDashboards.com directly your SharePoint list. Add download buttons in only a few steps. This template is one of dozens of button templates available at SharePointDashboards.com. New users can sign to access 21 free templates. There are hundreds of templates to choose from. Get the most out of your SharePoint libraries by using templates available at SharePointDashboards.com. |
June 25, 2025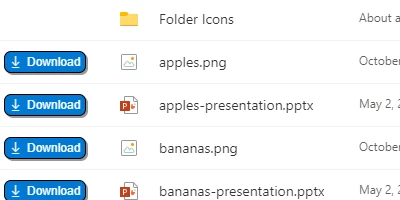
|
Easy to Use Task Board for SharePoint ListsSet up an easy to use custom task list in SharePoint. This custom task list template at SharePointDashboards.com allow for easily adding and updating tasking using a fluid and responsive grid view. This SharePoint list template is designed to be fluid and easy to update. Tasks can be prioritized and assigned with just a few clicks. Color coded status tracking makes it easy to visualize status providing a simple overview. Setting up the template requires a few settings adjustments then you can copy and paste the template directly to your SharePoint list. This list is one of several task list related templates at SharePointDashboards.com. If you are interested in setting up visual indicator templates in your SharePoint site, look no further than SharePointDashboards.com. Sign up for 21 free templates today with only your name and email. |
June 24, 2025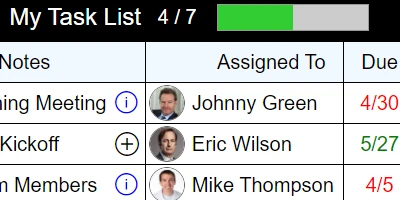
|
Highlight SharePoint List Rows with the Background Color Picker TemplateSharePoint lists look plain when using default SharePoint settings. It is much easier for users to understand status and priority records by highlighting SharePoint list rows using background colors. The Background Color Picker template at SharePointDashboards.com allows the ability to highlight SharePoint list rows easily with just a couple clicks. Applying the template is easy. Just copy and paste the template from SharePointDashboards.com directly to your SharePoint list. Critical records can be highlighted in yellow. Complete records can be highlighted in green. Assign your own colors according to your own work process. Getting started is easy. New users can sign up for access to 21 free templates. If you are looking to visualize data with row highlighting in SharePoint, look no further than SharePointDashboards.com. |
June 23, 2025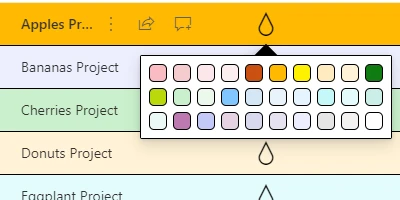
|
Add an Icon Picker to your SharePoint ListIcons are essential in SharePoint lists in order to show status and mark records with useful indicators. This can be used as part of an overall strategy of visual data management. The Fabric Icon template at SharePointDashboards.com allows users to select icons from a popup window to mark records according to status or priority. This template is highly configurable. Choose from hundreds of icons. Setting up this template is easy. Just copy and paste the template from SharePointDashboards.com directly to your SharePoint list. Users can update the icon directly from the SharePoint list view. Now SharePoint records can be updated with just a simple click. New users can sign up to access 21 free templates. This template is one of hundreds of templates available at SharePointDashboards.com. No app installation is required. Just copy and paste. |
June 22, 2025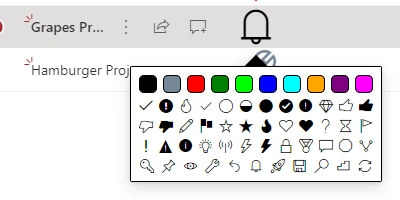
|
Add Area Charts to your SharePoint SiteArea Charts are a visually appealing alternative to Pie Charts which are used so frequently in diagrams. An Area Chart similarly shows proportional values by showing each shape in a size corresponding to its value. The only difference is that the area charts uses rectangles instead of pie wedges to show the proportional shapes. Adding an Area Chart to your SharePoint site is easy. Just copy and paste the template directly from SharePointDashboards.com. There are many options available to customize the appearance of your chart including colors, borders, font, sizing and more. This is one of more than 35 different charting options available. In fact, SharePointDashboards.com is a comprehensive SharePoint charting platform. Getting started is easy. Sign up with your name and email to get access to 21 free charting templates. |
June 21, 2025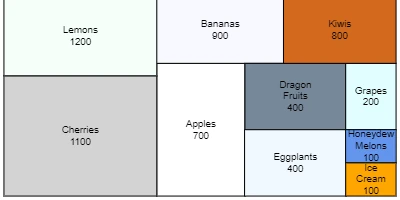
|
Embed Flow Charts in your SharePoint SitesFlow Charts are essential to help understand processes. A visual representation in invaluable to giving workers a clear understanding of steps. What's the best way to do Flow Charts in SharePoint? The SharePointDashboards.com Flow Chart template allows you to create flow charts directly from SharePoint lists. Just enter your steps and configuration then copy and paste the template from SharePointDashboards.com directly to your SharePoint list. There are many customization options which allow you to control the appearance of your flow charts. Choose, colors, background, font, shapes and more directly in the template. Once you are ready, simply copy and paste the template directly to your SharePoint list. This is one of more than 35 different charting templates available. Get started today with 21 free templates. |
June 20, 2025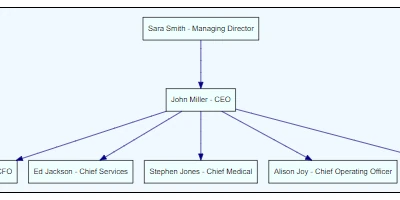
|
SharePoint Calendar Plus is the Ultimate SharePoint CalendarThe out-of-the-box SharePoint calendar is basic. It is missing many features that users expect in a custom calendar. The SharePointDashboards.com "Calendar Plus" template is the ultimate SharePoint calendar. This template includes many features not included in the plan vanilla SharePoint calendar. Add up to 8 custom events per day using custom icons and custom coloring. Explore calendar event details with the hover information box set to appear when hovering over events. The calendar day includes in depth information including event location, links, meeting details and other customizations that go far beyond regular SharePoint. This template can be installed in minutes. Download the template directly from the SharePointDashboards.com site and apply directly to your own SharePoint environment. If you are looking for the ultimate SharePoint calendar solution, be sure to watch the video to learn more. |
June 19, 2025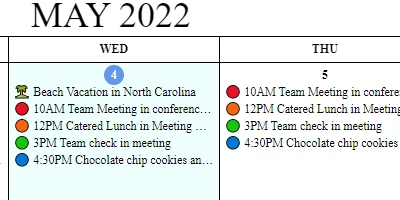
|
Input Logging Template for SharePoint ListsThe Input Logging Template allows you to set up a simple logging input in your SharePoint list so that you can append to a notes field with incremental updates. Users can apply these updates directly from the SharePoint list view. Deploying the template is easy. Just copy and paste the template directly from SharePointDashboards.com to your SharePoint list. Users tap into the functionality by entering a note then clicking the "Add" button directly in the in SharePoint list. Notes are automatically append to the SharePoint notes field. This template saves time by allowing users to make updates without needing to open a SharePoint form. This template is one of hundreds of templates available at SharePointDashboards.com. You can get started with 21 free templates then add a subscription to expand access to everything. |
June 18, 2025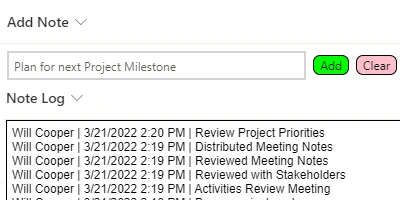
|
Add Multiline Text Input Fields to your SharePoint ListMultiline text input fields are essential to SharePoint list. This field can hold long information such as notes, descriptions and updates. The Multiline Text Input template at SharePointDashboards.com allows you to open up editing on this field directly in the SharePoint list view. Additionally, the styling of the text area can be set up to look any way you want. Choose your font, text size, text color and background color to match your own preferences. Optionally allow for a hover window effect and scrolling to improve the user experience. This is one of hundreds of templates available at SharePointDashboards.com. If you are looking to make your SharePoint lists look great and have improved user functionality, then SharePoint Dashboards has you covered. Deploying templates is easy. Just copy and paste directly to your SharePoint list. |
June 17, 2025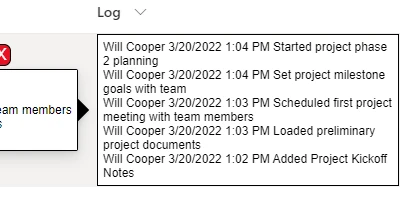
|
Customize the SharePoint Command Bar with an easy to use templateDid you know that you can easily customize which options appear on the command bar above SharePoint lists and libraries? Using the Command Bar template at SharePointDashboards.com you can easily add or remove options to the command bar and even changing the wording. Using this template you can work from a visual interface which builds the template according to your own unique requirements. This is especially useful when you want to hide certain options from users that don't apply. There are many options that appear by default. If you want to create a more focused user experience, then this is a good option to consider. If you would like to customize the command bar interface without having to write custom code, then SharePoint Dashboards is the easiest way to make that happen. Sign up for access to 21 free templates today. |
June 16, 2025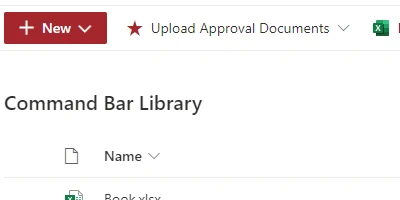
|
Upgrade your date field in SharePoint with the Date Input TemplateThe Date Input template at SharePointDashboards.com allows you to improve the functionality of the SharePoint date field. Applying this template allows dates to be edited directly in the SharePoint list view. In addition, dates can be adjusted using increment buttons that appear alongside the date. This template allows for improved efficiency since users no longer have to open the form to make date updates. The appearance of the date can be customized as well. Best of all, this is a free template which is part of the set of 21 free templates that are available when you get signed up. This is a great way to get started and learn what SharePointDashboards.com has to offer. Subscribers get access to hundreds of formatting templates which help improve your SharePoint site by making it more visual and user friendly. |
June 15, 2025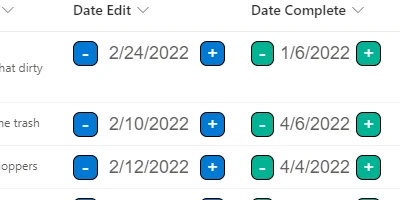
|
Build a navigation tree in your SharePoint siteNavigation is a key part of building SharePoint sites. What is you want to build a navigation hub screen that has many links? One great option is the Navigation Tree template at SharePointDashboards.com. This template allows you to create a navigation tree that can go up to three levels deep. This is a great way to show links when you need to allow for many different entries. This template allows you to control the styling of each level of links and set the look and feel options to match your branding. If you need to build out an long list of links in a SharePoint page, then the Navigation Tree template has you covered. Setting up the template is easy. Just apply your settings at SharePointDashboards.com then copy and paste the template directly to a SharePoint list. This is one of hundreds of options available. Sign up to get your first 21 templates for free. |
June 14, 2025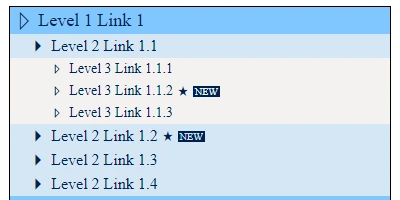
|
Add date increment buttons to your SharePoint listWorking with dates is a common need in SharePoint lists. Dates are used for planning and to track progress. Due dates are especially important. Using date increment buttons in your SharePoint list allows you to adjust dates with a single button click. This can be done directly in the SharePoint list view without opening the form. To add this convenient functionality to your list, use the Date Increment buttons template at SharePointDashboards.com. These buttons appear directly alongside your date fields to help you quickly adjust dates without any extra steps. This template is one of many date formatting templates available. Getting started is easy. New users get access to 21 free templates after initial signup. If you are looking to manage dates in your SharePoint site more efficiently then the date incrementing functionality will help you out right away. |
June 13, 2025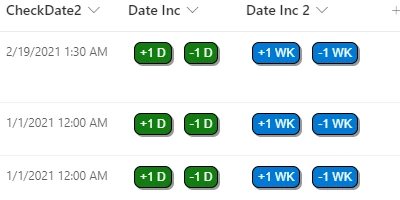
|
Add toggle buttons to your SharePoint listA toggle button allows users to easily switch the value of yes / no fields in a SharePoint list. This is similar to a checkbox. The toggle button is popular because it mimics a concept everyone understands - the light switch. Apply this template is incredibly easy. Head on over to SharePointDashboards.com to sign up for a free account. The Toggle Button Template is one of 21 free templates that are available for unlimited use. Make adjustments for the styling then copy and paste the template to your SharePoint column. That's it. In addition to this template there are hundreds of template options available. Whether you are looking for just some basic SharePoint improvements or you are looking for a complete SharePoint charting platform, SharePoint Dashboards has you covered. Check out the video to learn more. |
June 12, 2025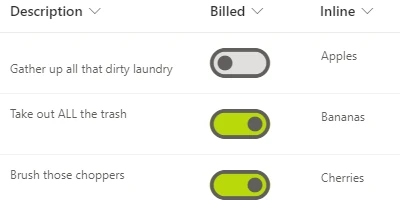
|
Add a Menu Button to your SharePoint ListThe menu button template allows you to include a menu button in your SharePoint list records so that users can easily access additional actions for that SharePoint list record. This is the menu that normally appears when you click on the three small dots next to the Title field in a SharePoint list. This menu is barely noticeable to users in the default state. By adding a prominent menu button, users can easily access key options without overlooking the default setting. This button can be style according to your preference to match your SharePoint branding. This button template is one of many button templates available at SharePointDashboards.com. Adding extra functionality to your SharePoint lists through buttons makes for a much more effective SharePoint user interface. Get started with 21 templates for free. |
June 11, 2025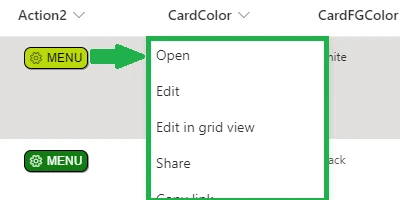
|
Add Inline Edit formatting to fields in a SharePoint ListHelp your users to make fast updates by applying the Inline Edit Template to your SharePoint fields. This template changes a field to allow users to make updates directly from the SharePoint list view. This is great for situations where users need to make quick updates as if they are updating an Excel workbook. This template can be applied just to select columns to ensure data integrity on the list. This avoids using the grid edit mode which is dangerous in that users can batch update any of the fields in a SharePoint list. This template is available with a free signup at SharePointDashboards.com. Using the template is incredibly easy. Just copy and paste the template directly to your SharePoint field and you are ready to go. This template is one of hundreds of templates available. Make your SharePoint lists look good and easier to use at the same time. |
June 10, 2025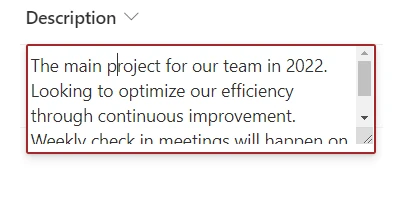
|
Add custom formatting to SharePoint form headersThe default form which appears with SharePoint lists is plain and doesn't contain any dynamic information. This form can be greatly improved using the Form Header / Footer template at SharePointDashboards.com. This template allows for inserting a styled form header which is attention getting and is more engaging for users. Set your own styles including background color, text color, border color, font size and family and more. This template is very easy to use. The preview screen shows exactly how the template will work even before you deploy. Once you are ready, just copy and paste the template directly to SharePoint. This template is one of hundreds of templates that you can use to improve the appearance of SharePoint forms and SharePoint lists. Get started by signing up for a free account with 21 free templates. |
June 9, 2025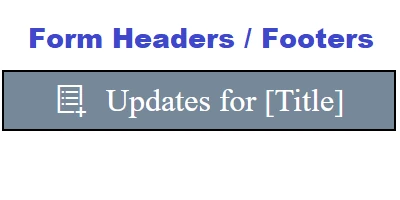
|
Add a Grouped Bar Chart to your SharePoint SiteA grouped bar chart is a way to compare data trends between different categories. This is like combining multiple bar charts into one bar chart. Out of the box SharePoint provides no way to make this kind of chart. Power BI provides this kind of capability but it very expensive and time consuming to build. SharePoint Dashboards provides the Grouped Bar Chart Template as well as 35 other kinds of charting templates at a very low cost. These templates are easy to deploy to SharePoint. Adjust your settings at SharePointDashboards.com then copy and paste the template to your SharePoint site. Not software installation required. New users can sign up to access 21 free templates. If you are looking for an easy way to add charting capabilities to SharePoint at a low cost, SharePointDashboards.com is a great option. |
June 8, 2025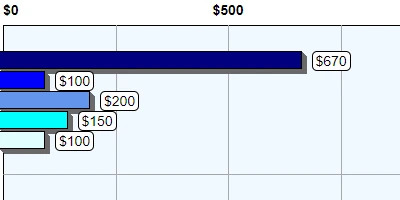
|
Embed Bing Maps in SharePoint ListsTracking address information is a common need in SharePoint. Customer data, site locations and destinations are often kept in SharePoint lists. Using the Bing Maps template at SharePointDashboards.com lets you visualize address information with a map directly in SharePoint views. This is a handy way to make boring SharePoint list views stand out with visualized map information. Setting up the Bing Map template is easy to do. Just apply the template to an address column in your SharePoint list. Using template from SharePointDashboards.com is easy. Just apply your settings, copy the template and paste to your SharePoint list. No installation required. There are many mapping templates including Google Maps templates as well. Get started today with a free signup which includes 21 free templates. |
June 7, 2025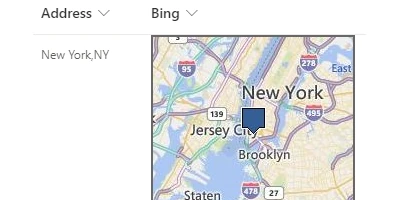
|
Show Approval Summary Information in a SharePoint ColumnApprovals are used frequently in SharePoint. A simple and fast way to improve your approval process in SharePoint is to use the Approval Summary template at SharePointDashboards.com. This template shows a list of approvers for a record and indicates the approval status for each approver. This template can accommodate up to ten total approvers. The great thing about this template is that it is simple to use and easy to understand. The approval column simply displays a summary of all approvals. This template can be deployed in just a few quick steps by configuring the settings then copying and pasting the template to your SharePoint list column. This template works great with the Approval Button template also available at SharePointDashboards.com. These templates make managing approval in SharePoint easy. |
June 6, 2025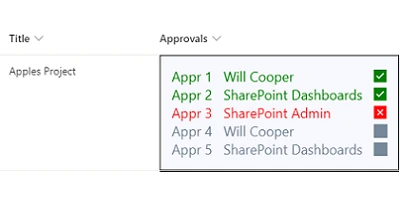
|
Display the weather forecast in your SharePoint SiteSharePoint feels a lot more inviting if useful information is included that appeals to all users. The Weather Forecast template available at SharePointDashboards.com allows you to insert a dynamic weather forecast section directly in your SharePoint page. This is one of three different weather forecast related templates available. Whether you want to display the current weather conditions, the weather forecast or the current weather radar, all situations are covered. When doing work, it is handy to know when rain or snow is coming or whether there is going to be a very hot day or a very cold day. Users will love this functionality and there will be more activity in the site by including this helpful content. There are hundreds of dynamic templates available. You can get started with 21 free templates at SharePointDashboards.com. |
June 5, 2025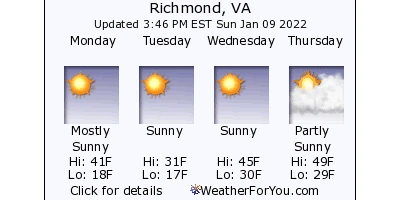
|
Set up an Asset Tracking System with this Formatted TemplateAsset Tracking is a key requirement in organizations especially when it comes to technology based systems. Setting up an effective asset tracking system in SharePoint requires a great looking dashboard to see key information. The Asset Tracking Cards template at SharePointDashboards.com is the perfect copy and paste template to make a great looking asset tracking list. This template allows you to visualize assets with pictures and key information including status, location, make, model, serial number, quantity, purchase date and more. This template is much more effective than a basic SharePoint list. By visualizing asset information, it is easy to browse through asset cards easily identifying different types of equipment and key status updates. Setting up this template is easy. Just copy and paste the template from SharePoint Dashboards to your SharePoint list. Get started in minutes. |
June 4, 2025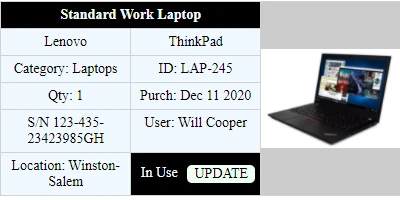
|
Highlight Current User in SharePoint ListsThe "Highlight Me" SharePoint Dashboards formatting template allows you to highlight the current user in SharePoint lists. This is useful for calling attention to projects and tasks that are assigned to the current user. This formatting template makes it clear which records matter to the person who is logged in. This template is simple to use. In the SharePointDashboards.com site, set the formatting highlight option according to your own preference then copy and paste the template directly to your SharePoint list column. This template is one of hundreds of formatting templates available in the SharePoint Templates Gallery. New users can get access to 21 free templates available for unlimited use. All templates include instructional videos. SharePoint Dashboards is the easiest way to add extra functionality to your SharePoint site. |
June 3, 2025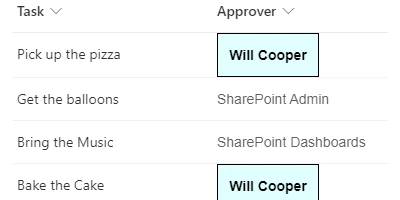
|
Create Event Cards List with your SharePoint ListAdding nice looking event cards to your SharePoint site is a great way to post information on upcoming events in your SharePoint landing page. Using the Event Cards template at SharePointDashboards.com it is easy to get your event cards set up in just a few minutes. Using this template, you can control with size and appearance of your cards to match your own custom branding. It is easy to update event information by clicking on the buttons shown at the bottom of the card. Using the template requires simple copy and paste from the SharePointDashboards.com site. This template is one of hundreds of great templates available to help improve your SharePoint site. Check out examples of all the great templates at the SharePoint Dashboard gallery. |
June 2, 2025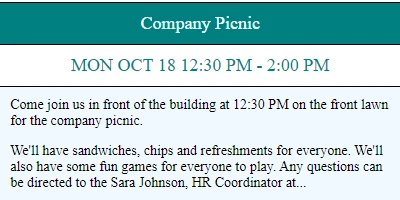
|
Display an Image Gallery using a SharePoint ListCreating a nice looking image gallery in SharePoint is easy to do. The SharePointDashboards.com Image Gallery template enables displaying a nice looking image gallery using just a SharePoint list. This template is easy to configure. Just set the height and width of the images to be displayed and optionally include other settings such as a hyperlink to be included with each picture. The images are displayed as tiles in a SharePoint gallery view. If you want an easy and fast way to display images in SharePoint then this template can be set up in only a couple minutes. This template is one of many image related templates at SharePointDashboards.com. If you have not yet used this site, you can sign up for free access to 21 templates. Subscribers gain access to hundreds of template options. |
June 1, 2025
|
Date Time Field Difference in SharePoint ListsDate Time fields are used for tracking key information in SharePoint lists. SharePoint doesn't provide a great way to see the different between two date time fields. Using SharePointDashboards.com it is possible to show the difference between date time fields in a user friendly manner. There are many format options to choose from. Select from many different date time formatting options then set the style of the output including colors, border and font style. Using this template is easy. Just use the provided Date Difference formatting template at SharePointDashboards.com. Adjust your options then copy and paste the template to your SharePoint list. Now the date time difference is prominently displayed in your SharePoint list view. This template is one of hundreds of templates available at SharePointDashboards.com. |
May 31, 2025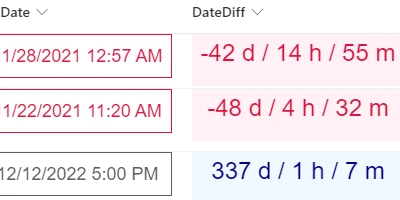
|
Date Time Formatting in SharePoint ListsFormatting Date Time fields in SharePoint lists is essential. Controlling the appearance of the information makes for a more user friendly experience. Out of the box SharePoint doesn't provide a good way to do this. Using the Date Format template at SharePointDashboards.com you can control the formatting of date time fields easily. Every part of the formatting is under your control. Formatting options allow you to choose whether to show the day of the week, the month name, hour, minutes and more. Optionally select to allow for inline editing which allows users to update the information directly from the SharePoint list view. The style of the output can be adjusted so that you can use whichever font style, colors and border that you want to fit your own environment. This is one of the easiest templates to use at SharePointDashboards.com. If you are new to SharePoint Dashboards, you can sign up for free access to 21 templates to get started today. |
May 30, 2025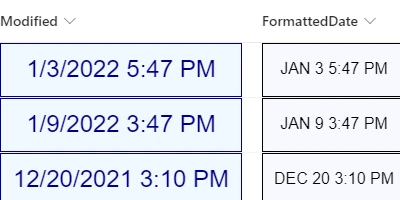
|
Charting for SharePoint OnlineSharePoint Online does not include robust charting tools. The best way to be able to do charts in SharePoint Online is to use the charting templates available at SharePointDashboards.com. This site includes more than 35 different charting templates which can be set up and deployed in minutes. No software installation is required. Deploying templates can be done with simple copy and paste. These templates allow for creating charts based on SharePoint list data using JSON formatting templates. The best part about SharePointDashboards.com is that no coding is required. Adjust your settings to make your chart look exactly how you want then copy and paste the template to your SharePoint site. You can browse all the charting options here: https://sharepointdashboards.com/gallery/?category=charting |
May 29, 2025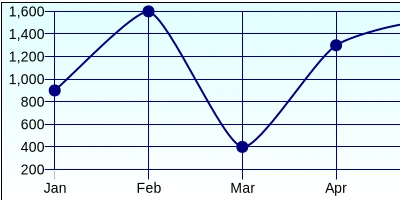
|
Build Dynamic SharePoint forms with no code using Infowise Ultimate FormsCustom forms are the heart of every SharePoint Solution. What's the best way to create custom forms in SharePoint? Microsoft offers simple options with SharePoint lists and Microsoft Forms that are OK for basic forms. For dynamic forms, Microsoft Power Apps is a developer oriented platform which requires creating logic through custom programming. The best option for non-SharePoint developers is the no code Form Designer tool from Infowise Ultimate Forms. Ultimate Forms Form Designer allows anyone to build custom forms without doing any programming. What makes it so easy to work with? In this article we'll take a close look at what makes Infowise Ultimate Forms so easy to use. |
May 28, 2025
|
Include a video button to play videos in your SharePoint siteDo you store videos in your SharePoint site? Adding a video button to your library allows videos to be played with just a simple button click. The video button template at SharePointDashboards.com is 1 of 21 free templates that you can access right now with a free signup. SharePointDashboards.com includes many different button templates to help automate tasks and create an overall more user friendly experience. Button templates are simple to use. Just configure the style options including colors, font style and hover effects according to your own preferences. Just copy and paste the template directly to a column in your SharePoint list. There are hundreds of template options available at SharePointDashboards.com. If you work with video files in your SharePoint site, then the video button template is a great way to improve your user experience right away. |
May 27, 2025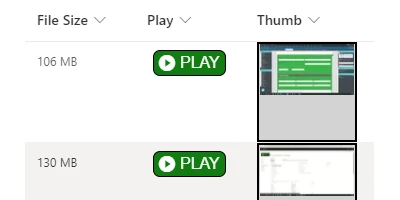
|
Create a FAQ in your SharePoint siteSetting a FAQ section in your SharePoint site is easy to do. Using the FAQ Cards template at SharePointDashboards.com you can create a nice looking FAQ page in SharePoint in only a few minutes. This is a great way to post a list of answers to common questions about an important topic in your organization. Control the look of your FAQ cards by using the configuration settings in the template screen. Control the size of the FAQ cards, the colors and font styling according to your own preferences. Once you are ready simply copy and paste the template to your SharePoint list. Now users can easily find answers to common questions using a page that is visually appealing and easy to work with. New users can sign up to get access to 21 free templates. This template is one of hundreds of options available at SharePointDashboards.com. |
May 26, 2025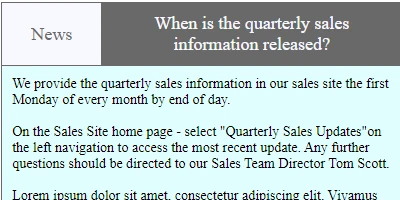
|
Add Employee Profile Cards to SharePointAdding an employee directory is a great way connect your team members. Using the Employee Cards template at SharePointDashboards.com you can set up a nice looking employee directory in just a few minutes. The employee cards automatically show the user profile picture making the directory look more friendly. This template automatically pulls in job title and department information to the card. The employee cards can be configured to use whichever style you prefer. Adjust background colors, font style and card size according to your own preferences. Deploying the template only requires copying and pasting the template to your SharePoint list. This template is closely related to another handy Phone Directory template also available at SharePointDashboards.com. New users can sign up to get free access to 21 templates. |
May 25, 2025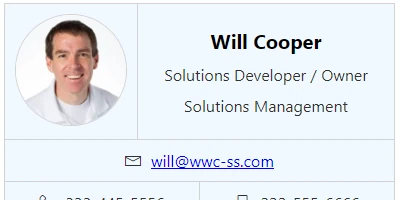
|
Add Interactive Task Cards to your SharePoint ListsAssigning tasks is a common activity in project management in SharePoint. Out of the box SharePoint doesn't provide a good way to visualize task assignments. The task cards template at SharePointDashboards.com allow you to display tasks assigned to users that can be edited directly from the SharePoint list view. Each person can have their own personalized view to review all assigned tasks and make updates. Controlling the look of the task cards is easy using the task cards template at SharePointDashboards.com. Adjust the configuration options including colors, font style, borders, size and more. Deploying the template is easy. Just copy and paste the template directly to your SharePoint list view. No programming or installation is required. New users can sign up at SharePointDashboards.com to get access to 21 free templates. |
May 24, 2025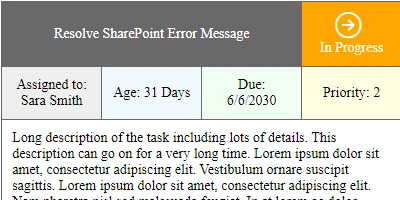
|
Set up a Weekly Calendar Schedule Grid in SharePointA weekly schedule calendar is a great way to show the schedule in a way that is easy for everyone to understand. This template works with a SharePoint list by showing scheduled events during the week. This template includes lots of options including background color styling to highlight different categories of events. Setting up the template is easy. Using the provided tool at SharePointDashboards.com it is possible to copy and past the template to your SharePoint site in just a few minutes. This template is one of many different calendar option templates available. Getting started is easy. New users can sign up for 21 free templates to get started. Planning your calendar and scheduling has never been so flexible in SharePoint. Check out all the great calendar templates at SharePointDashboards.com. |
May 23, 2025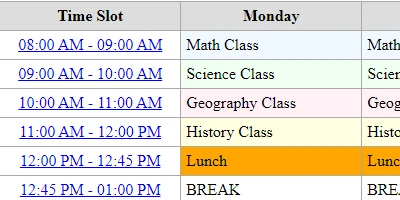
|
Build a Stacked Bar Chart in SharePointSetting up a stacked bar chart in SharePoint is impossible with out of the box tools. There are other options outside of SharePoint that are expensive and difficult to use. SharePointDashboards.com provides an easy to use stacked bar chart template that can be used with SharePoint lists. Setting up the chart is easy. Provide the names of the fields from your SharePoint list and adjust look and feel options until the chart looks exactly the way that you want. Deploying the template requires simple copy and paste. No programming is required. Stacked bar charts are a great way to show aggregated totals across different categories. SharePoint Dashboards includes more than 35 different charting templates to visualize data. Getting started is easy. You can sign up for 21 free templates with just your name and email address. |
May 22, 2025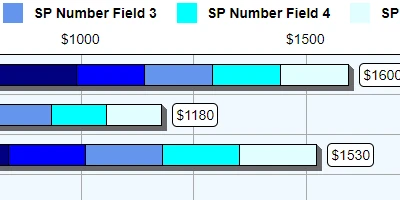
|
SharePoint JSON Formatting Templates No Code ToolSharePoint Dashboards is the new way to take advantage of SharePoint list and column formatting without writing any code. The SharePoint Dashboards templates are created automatically based on choices you make in the UI. Every template allows easy updates to colors, borders, font, width, height and more. Instead of trying to make difficult programming updates in JSON code, the templates at SharePointDashboards.com require simply copy and pasted. Save time and hassles by eliminating the need to do any programming to take advantage of SharePoint list formatting templates. Getting started is easy. New users can sign up to get access to 21 free templates. Subscribers get access to hundreds of templates which are easy to browse on the SharePointDashboards.com site. SharePoint JSON list formatting has never been so fun and easy. |
May 21, 2025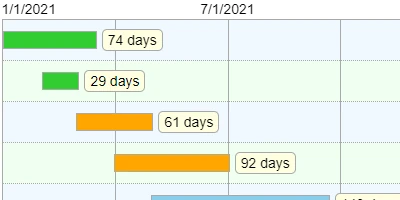
|
Show QR Codes in your SharePoint ListQR Codes are a handy way to allow cell phone users to access a web site. Using the QR Code template at SharePointDashboards.com you can embed QR Codes directly in your SharePoint list. This template is simple to use. Create a regular SharePoint text field to hold hyperlinks. Go to the SharePointDashboards.com site and access the QR Code template. Adjust the size, colors and other options to make your QR Codes look just the way you want. Once the preview looks good, simply copy and paste the template to your SharePoint list. This template can be set up in minutes. This template is one of hundreds of SharePoint JSON formatting templates available at SharePointDashboards.com. All templates are accessed through the visual interface. No programming is required. You can sign up to access 21 templates for free. |
May 20, 2025
|
Add Polar Charts to SharePoint as a Twist on Boring Pie ChartsSharePoint provide almost no charting capabilities out of the box. Using SharePointDashboards.com templates you can add up to 35 different kinds of charts to your SharePoint lists. The Polar Chart is an interesting twist on the all too common pie chart. In a polar chart, the wedges change in appearance by scaling outwards. This kind of chart is much more eye catching than pie charts which are so frequently used. Add a Polar Chart to your SharePoint site requires simple copy and paste from SharePoint Dashboards. Just configure the appearance of the chart in the SharePoint Dashboards screen then you are ready to deploy. If you are interested in an easy to use tool to add charts to SharePoint, look no further than SharePointDashboards.com. All of your charting needs are fully covered. No more using expensive programming oriented tools. This is a great alternative to Microsoft Power BI. |
May 19, 2025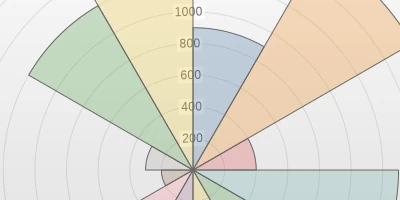
|
Add a Rollover Image Hover Box to your SharePoint ListImages are a great improvement to SharePoint lists. How can you load images to lists without stretching out the user interface? The Image Hover Box template at SharePointDashboards.com allows you to hover over an image thumbnail in a SharePoint list and display a larger version of the image. This looks nice and allows you to make images a major part of your SharePoint list tracking. This template can work on either the SharePoint Image field or SharePoint hyperlink field. Setting up the template is easy. Just pick the dimensions for the hover window as well as aspect ration and border settings. Once the preview looks right, copy and paste your template from SharePoint Dashboards to your SharePoint list. It is easy to use and looks great. This is one of many image related templates that you can use including picture slideshows and image libraries. There are hundreds of similar templates available at SharePointDashboards.com. |
May 18, 2025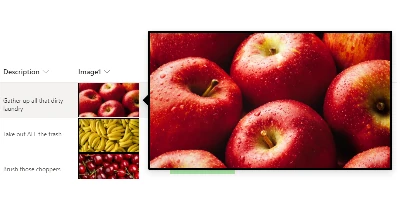
|
Speedometer Style Gauge Template for SharePoint ListsProgress indicators are a vital part of project tracking in SharePoint. It is especially helpful to see the percentage value completion of tasks and projects. Including an eye catching indicator helps this information stand out in SharePoint lists. The Radial Gauge indicator at SharePointDashboards.com is the perfect formatting template to make this information stand out in your SharePoint list. Setting up the template is easy. Adjust your colors and styling to your own preferences then copy and paste from the SharePoint Dashboards site to your SharePoint list. This template can be used with a number column using values from 0 to 100. This template is one of hundreds of options available at SharePointDashboards.com. Sign up to begin using the 21 free templates today. |
May 17, 2025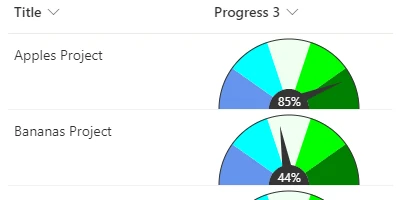
|
Highlight SharePoint Rows by StatusMany SharePoint lists use a choice field to indicate status on records. Typical status values are "Not Started", "In Progress", "On Hold", "Canceled" and "Complete". To help the status stand out, the Row Highlight Condition template can be used to add a background color to SharePoint list rows according to status. Setting up the template is easy. Just set the colors for each value and adjust other options which control the look of the view. Copy and paste your template from SharePointDashboards.com to your SharePoint list view. Using row highlighting allows each record to stand out and makes it the status obvious for each record. There are hundreds of templates available at SharePointDashboards.com. Sign up for free to begin using the first 21 template. |
May 16, 2025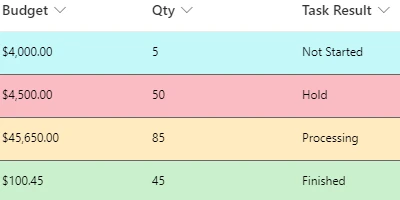
|
Row Day Highlighting for SharePoint ListsDue dates are a key indicator in many SharePoint lists. It is critical to know when due dates past so that payments are made or work gets complete. By default these dates blend together in SharePoint list views. By using the Row Date Highlight template at SharePointDashboards.com it is possible to show rows highlighted with a background color according to the date value. Rows can be highlighted in three different colors according to conditions. Rows with dates that have past can be one color, rows where the date is the current date can be another color and rows where the date is in the future can be a third color. In this way it is easy to see when deadlines have past and take action on critical items. This template is easy to use. Choose your own row styling then copy and paste your template to SharePoint. |
May 15, 2025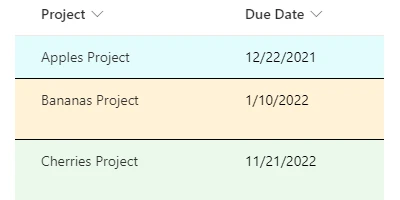
|
Add a Formatted Date Box to your SharePoint Date FieldDates are in every SharePoint list. The Created Date and Modified date are included. Additionally it is common to add date fields to SharePoint lists for tracking purposes. Unfortunately, the out of the box date field looks plain and does not stand out in the list view. Using the Date Box template at SharePointDashboards.com allows you to easily format your SharePoint date columns to stand out in the view and grab attention. Additionally it is possible to show the weekday name as part of the output. Setting up this template is easy. Just pick from the color, border and font options in the template screen then copy and paste the template to your SharePoint list. If you have not yet used SharePoint Dashboards, you can sign up to access 21 free templates and later sign up for a subscription to gain access to hundreds of options. |
May 14, 2025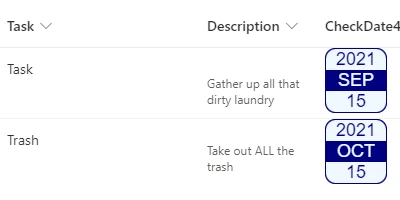
|
Add Hyperlink Buttons to SharePoint ListsThe hyperlink field is often used in SharePoint to provide links to key resources. Unfortunately the out of the box format of the hyperlink is not user friendly. The Hyperlink Button template at SharePointDashboards.com allows you to easily format links that look nice in SharePoint list views. Adjust the colors, font and border to look any way you want. No coding is required. Just copy and paste the template to SharePoint. This template is free to use along with 20 other additional free templates which you can begin using today. Subscribers gain access to hundreds of SharePoint dashboard templates which allow all kinds of different functionality. The variety of options is truly amazing. Browse through the gallery of options including dozens of button templates at SharePointDashboards.com. |
May 13, 2025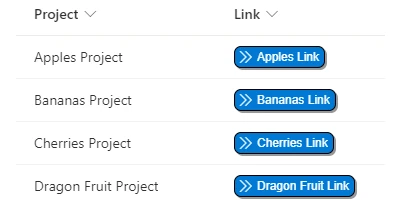
|
Set up Column Bar Charts in your SharePoint ListBar charts are a great way to visualize data in SharePoint. Unfortunately, it is difficult to do without additional tools. Power BI is one alternative, but this is expensive and developer oriented. SharePointDashboards.com has an easy to use and affordable charting platform offering more than 35 different kinds of charting templates. Using the tool is easy. Just select from different configuration options to set up the appearance of your bar chart exactly the way that you want. Once the chart preview looks how you want, just copy and and paste the chart directly to your SharePoint list. No coding required! SharePointDashboards.com requires only 1 license for the user creating the charts. This is much better than Power BI which requires user licenses for all users viewing charts. Sign up to get access to 21 free templates and get started today. |
May 12, 2025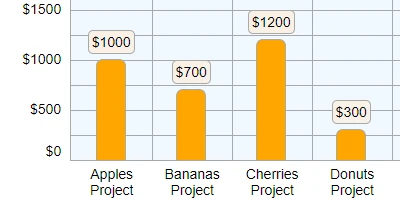
|
Add Custom Bar Charts to your SharePoint ListsBar charts are a popular and universally understood visualization of data. Unfortunately, SharePoint does not provide a great bar chart option on its own. What's provided is far too basic. The Bar Chart template at SharePointDashboards.com includes loads of configuration options which allows you to configure a custom bar chart that appears exactly the way you want. The preview windows show exactly how your bar chart will look as you adjust the configuration. Once everything looks how you want, simply copy and paste to your SharePoint list from SharePointDashboards.com. The bar chart template is one of more than 35 different charting options available at SharePointDashboards.com. Charting in SharePoint is easy and affordable using charting templates from SharePointDashboards.com. |
May 11, 2025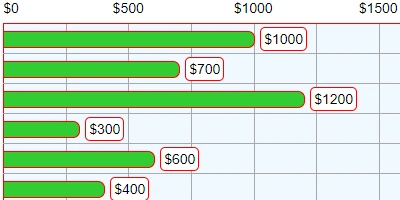
|
Add a Radial Gauge Chart to your SharePoint ListA radial gauge is much like a pie chart in that it shows a circle shape that fills according to a percentage value. A radial gauge is a visually compelling way to show progress related to projects and tasks in SharePoint. The radial gauge template at SharePointDashboards.com allows you to adjust all aspects of the chart including colors, borders, sizing and more. This template is easy to use. Just adjust the settings until the preview looks exactly how you want. Deploy using simple copy and paste to your SharePoint site. The radial gauge is one of more than 35 different kinds of charting and progress bar templates available at SharePointDashboards.com. The first 21 templates are free and subscribers can tap into hundreds of easy to use copy and paste templates. |
May 10, 2025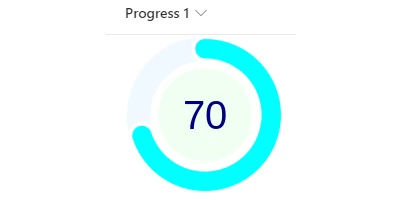
|
Sparkline Line Charts for SharePointVisual indicators improve SharePoint list views tremendously. Often it is important to show a data trend to show how numbers change over time. The Sparkline template at SharePointDashboards.com allows you to add a mini line chart directly to your SharePoint list view which indicates progress over time. This template is easy to use. Just enter your number fields from your SharePoint list then adjust the colors and dimensions of the chart as you want it to appear in your SharePoint page. Applying the template requires simple copy and paste to your SharePoint list. This chart is one of more than 35 charting options available at SharePointDashboards.com. Adding line charts to your SharePoint lists has never been easier. New users can sign up to try SharePoint Dashboards for free with 21 templates. |
May 9, 2025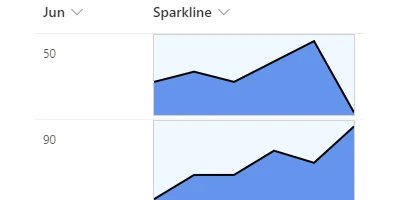
|
Add Google Maps Cards to your SharePoint List ViewsMany lists in SharePoint contain location information including addresses. Customer lists, site locations, trip destinations all can be tracked in SharePoint lists. Including Google Maps is a great way to improve the appearance of that information. Google Maps can be displayed directly inside of SharePoint using the Google Maps Card template at SharePointDashboards.com. This template allows you to reference an address column in your SharePoint list to display a map of that location in the SharePoint list view. Clicking on the map tile will open the full map in another browser tab. There are lots of configuration options to display the map how you like including zoom level and map style including hybrid, satellite, road map and terrain. Deploying the template requires simple copy and paste. |
May 8, 2025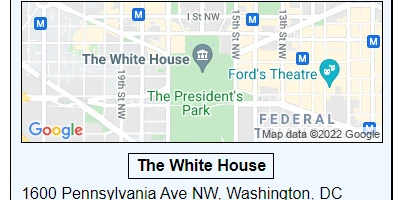
|
Improve SharePoint Multiselect Choice Fields with FormattingMultiselect choice fields are a common part of SharePoint lists. The default appearance of these fields in SharePoint lists is a limiting. By applying the multiselect input formatting template at SharePointDashboards.com you can control the appearance of this field easily. Adjust settings to control colors, border, font size and font family for the field using easy configuration choices in the tool. The best part about using this tool is that no programming is required. Once you have applied the settings and your preview looks as you want, simply copy and paste the template to your SharePoint column. This template is one of hundreds of options available at SharePointDashboards.com to improve the appearance of your SharePoint list views and SharePoint pages. |
May 7, 2025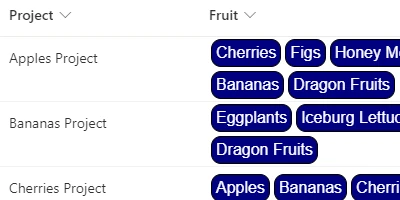
|
Add Donut Charts to SharePoint PagesAdding a donut chart to SharePoint pages is easy using SharPointDashboards.com. A donut chart is a variation on a pie chart that has a cutout in the middle. Using configuration options at SharePointDashboards.com you can create donut charts that look exactly how you want. There are several options available which allow you to control, borders, background, text styling and key using easy to understand options. Best of all, no programming is required in order to configure your donut chart. Once you have applied the settings and the preview looks as you want, you can copy and paste to your SharePoint list view. The donut chart is one of more than 35 different charting options available at SharePointDashboards.com. When it comes to adding charts to SharePoint, SharePointDashboards.com is the easy and effective no code solution. |
May 6, 2025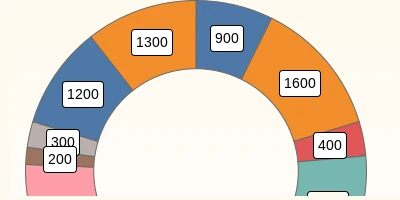
|
Great Looking Pie Charts in SharePointPie charts are a common and popular way to visualize SharePoint data. Using out-of-the-box SharePoint allows for only a very simple pie chart with no configuration options. SharePointDashboards.com provides pie chart templates with loads of configuration options which allow you to configure your charts to look however you want. Configuration options allow you to adjust borders, background colors, chart key, font and other options. The size of the chart can be set to match exactly the dimensions needed for your SharePoint page. Set up is easy. Just copy and paste the template from SharePoint Dashboards to your SharePoint site. There is not installation needed and no need to use any additional platforms. SharePoint Dashboards provided more than 35 different charting options to display your SharePoint data. |
May 5, 2025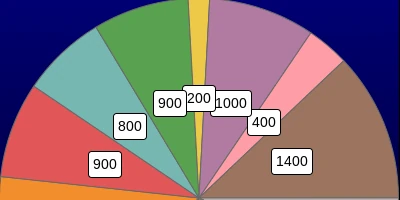
|
Versatile Line Charts in SharePointSharePointDashboards.com provides a versatile line chart option which allows you to embed line charts in SharePoint using simple copy and paste templates. Line charts are useful to show data trends using your SharePoint list data. Setting up the template is easy. Just adjust the colors, fonts, border and other appearance options to make your line chart look how you want. Once your template is ready, deploying the chart to SharePoint requires only simple copy and paste. Color option allow for gradient image transitions. Different marker styles can be used on the chart for interesting effects. Charts can be displayed on SharePoint landing pages using the list web part. With more than 35 different charting templates to choose from, SharePointDashboards.com is an great way to visualize data in SharePoint. |
May 4, 2025
|
Horizontal Bar Charts Made Easy in SharePointBar charts are an essential way to show data trends with SharePoint data. Unfortunately, out-of-the-box SharePoint doesn't provide a good way to do charting. Using SharePointDashboards.com chart templates is an easy and flexible way to do charting in SharePoint using only SharePoint lists. With over 35 different charting templates available, just about any chart option you might need is available. The horizontal charting templates allows you show aggregated values such as total sales by months. Lots of fine tuning options are available to get the chart to appear just exactly as you want. Once your configuration is ready, just copy and paste the template directly to the SharePoint list view. Using SharePointDashboard.com print templates is the easiest way to do charting in SharePoint! |
May 3, 2025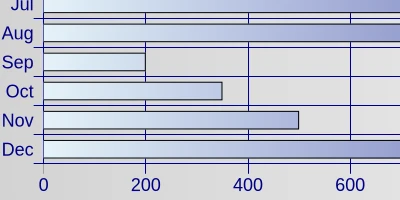
|
Column Bar Charts in SharePoint Lists Made EasyYou can display column bar charts directly from your SharePoint lists using charting capabilities from SharePointDashboards.com. This template provides many different configuration capabilities so that you can fine tune the appearance of your chart. This template will render an image based on the data in your SharePoint list record. The best part is that no coding is required. Just update your styling preferences in the user interface then copy and paste the template to your SharePoint list. A great use for this chart is showing monthly summary data for a calendar year. For example, you might show total amount for sales for each month of the year. This chart updates dynamically based on the underlying SharePoint list data. Once the chart is set up, it will automatically update any time the underlying data changes. This chart can be easily displayed on SharePoint pages by using the list web part. |
May 2, 2025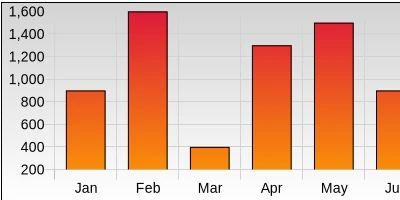
|
Add Gradient Progress Bar to your SharePoint ListAdd a dynamic progress bar with a gradient background to create a nice look in your SharePoint list. A gradient progress bar shifts color gradually from left to right according to a percentage value. An easy way to understand this is "cold to hot" where cold is represented as blue and hot is represented as red. In a gradient progress bar the color shifts gradually from blue to red as the percentage value changes from 0 to 100. There are several color options to choose from depending on what is being measured. A gradient progress bar looks more polished because it isn't one fixed color as is more typical for what is provided in standard SharePoint. If you want a more polished looking progress bar indicator, then the Gradient Progress Bar template will make things look much nicer. Setting up this template requires only simple copy and paste. |
May 1, 2025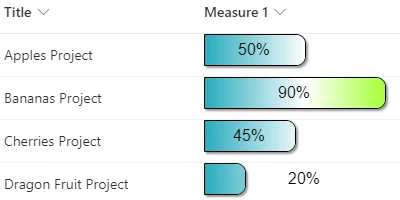
|
Add an Email Button to your SharePoint ListAdd an email button to your SharePoint list next to a person field to allow users to send an email with just one click. This copy and paste template allows you to add a simple email button directly in your SharePoint list view. Clicking the button automatically opens a new email to the corresponding person in the person field for that record. The button automatically reads the email address of the assigned user. The look of the button can be easily configured according to your own preferred style. This button template is one of more than 20 different button templates available at SharePointDashboards.com which can improve functionality and make your SharePoint lists easier to use. This template is included as part of 21 free templates available for download. |
April 30, 2025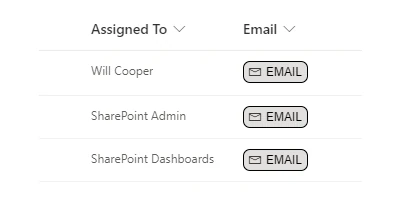
|
Add Profile Pictures to SharePoint ListsAdd profile pictures to SharePoint lists with this easy copy and paste template. Normally SharePoint displays only the name of the user in the person field. Applying this templates allows you to display the user profile picture whenever setting a name in a person field. Adding a picture provides a more engaging user experience that breaks up the monotony of the default SharePoint view. Multiple formatting options are available so that you can display the person information according to the style that you need. You may display either a square or round profile picture, allow for inline edit and control the appearance of the name under the picture. Deploying this template requires only simple copy and paste to SharePoint. This is an easy and fun way to make your SharePoint lists look great. |
April 29, 2025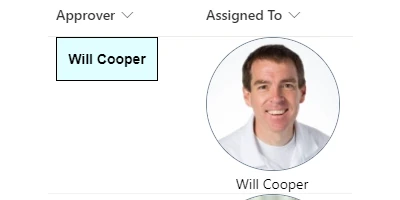
|
Add a Delete Button to your SharePoint ListEasily add a delete button to your SharePoint list with this formatting template. This button works great with edit and view buttons to help users more easily update records. Use different formatting options to adjust the appearance to best fit your SharePoint site. Using this template allows deleting SharePoint list records with just one click on the left side of the SharePoint list record. This button template is one of more than 20 button templates that you can use in your SharePoint lists available at SharePointDashboards.com. If you are looking for dynamic buttons that make the SharePoint list view more accessible, then this button template is an essential template to add to the mix. Setting up the template is easy to do. Only simple copy and paste is required. |
April 28, 2025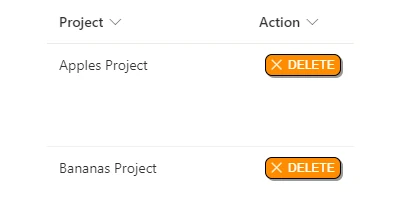
|
Add Promoted Links Navigation Tiles to Your SharePoint Home PageTile links are the most popular style of links to display on SharePoint pages. Users connect with this appearance because it mimics the square tile links that we see on our mobile phones. The Promoted Links Template at SharePointDashboards.com includes customization options that allow you to make your own great looking navigation tiles that look exactly how you want. Configuration options allow you to fully customize the font, icon size, colors and border to get the exact appearance that you want. The hover styling allows even more customization. This template is similar to the Quick Links web part most often used on SharePoint pages, but adds much better customization options by allowing for complete style configuration and size adjustments. If you are wanting a more customizable tiles style navigation then you will love the flexibility of this template. Just pick your look and feel options, then copy and paste to your SharePoint list. No programming is required. |
April 27, 2025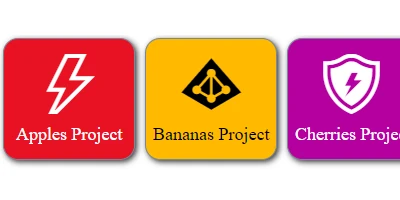
|
Improved SharePoint List Row FormattingSharePoint lists are at the core of SharePoint. Lists are used to track just about any kind of information needed including tasks, projects, help desk systems, purchase order systems and much more. Normally SharePoint lists are plain looking with a white background, but they can be formatted to be easier to read with row formatting. The Row Formatting Template at SharePointDashboards.com allows users to set alternating row styles to approve the overall appearance of SharePoint lists. This template is one of 21 free templates available at SharePointDashboards.com. Setting up the formatting is easy with no programming required. Just pick your color and style options then copy and paste the template to your SharePoint list view. Making your SharePoint lists look better can happen in only a few minutes. |
April 26, 2025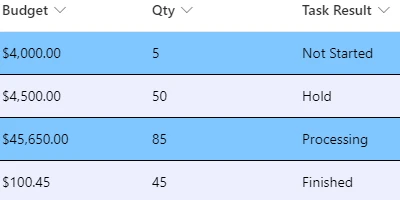
|
Dynamically Highlight Dates in SharePoint ListsDate fields are a critical part of SharePoint lists. In just about every list there is some of date tracking. The date field can be improved with dynamic highlighting according to whether the date is in the past, today or in the future. A free Date Highlight template is available at SharePointDashboards.com along with 21 other free templates. Using this template is easy. Just pick from the style options include font, border and colors to format the date column exactly how you want. Copy and paste your template directly to your date column in your SharePoint list. Now users can easily identify the date status to determine whether dates are upcoming, today or in the past. This is one of hundreds of easy to use templates at SharePointDashboards.com. |
April 25, 2025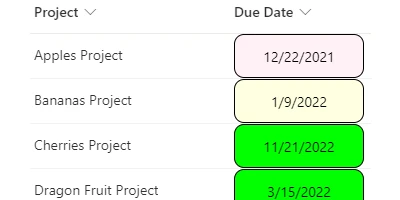
|
Use Color Coded Choice Fields in SharePoint ListsChoice fields are used all the time in SharePoint lists. Formatting choice fields to use different borders, fonts and colors help them stand out compared to plain looking out-of-the-box SharePoint lists. Using the SharePointDashboards.com Choice Input formatting template, you can set your choice options to be styled exactly how you want. This is great when you have a category field, type field or any other type of selection. Use this template by picking from easy to understand configuration settings then copy and paste to your choice column in your SharePoint list. This template is one of 21 free templates that you can get at SharePointDashboards.com. Try out all the free templates then explore the additional 200+ options available as part of the subscription option. Creating great looking SharePoint Dashboards is easy at SharePointDashboards.com! |
April 24, 2025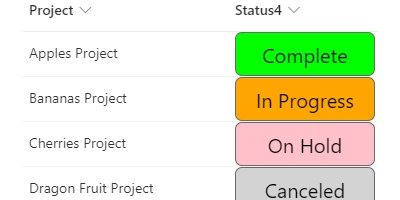
|
Add Dynamic Progress Bars to Your SharePoint ListProgress Bars are commonly used to indicate progress towards a goal. In SharePoint lists, progress bars can be used to provide a visual indicator comparing progress between different tasks or projects. The SharePointDashboards.com Dynamic Progress Bar template allows for a progress bar that changes color according to threshold values. For example, you might want to make your bar have a blue background color when it is a low value, but then change to green when it gets full. All of this is easy to configure with no programming required. Just copy and paste the template directly to your SharePoint list number column. Configure the style of your progress bars including colors, borders and size however you want. The Dynamic Progress Bar template makes setting up SharePoint list view easy and fun. |
April 23, 2025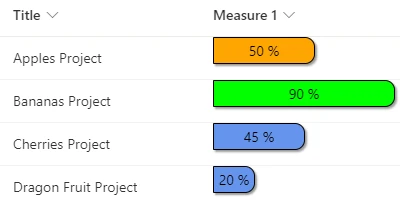
|
Add Stacked Progress Bar Indicators in SharePoint ListsProgress bars show in all kinds of SharePoint Dashboards. Progress bars are a simple and easy way to understand a value from zero to max value when comparing against other values. The SharePointDashboards.com Triple Progress Bar Template allows you to stack three progress indicator bars in one column in your SharePoint list. This is great for situations where you have three key values that you want to track in your SharePoint list record. For example, you might want to show a bar for total progress completion, a bar for number of tasks complete and a bar for money spent. Applying this template is easy to do. Just adjust the style for the template at SharePointDashboards.com then copy and paste the template directly to your SharePoint site. Best of all, no programming is required. |
April 22, 2025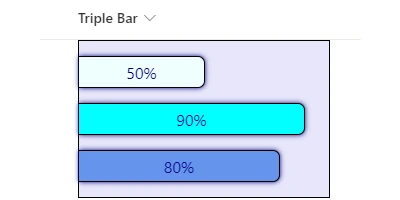
|
Add a Pie Chart Indicator Directly in Your SharePoint ListPie charts are a universally understood method to show percentage values in data. Add the SharePointDashboards.com Pie Percent indicator to your SharePoint list column to visualize percentage data for great looking SharePoint Dashboards. The appearance of the pie chart is completely customizable and can show different colors according to different percentage threshold values. Whether you want small pie chart indicator or a pie chart that is large and stands out in your list, everything is completely customizable. Just copy the template from the SharePointDashboards.com site and paste directly to your SharePoint number field. That's it! No programming is required. This is a simple and easy to use template that is sure to make percentage data look great in your SharePoint lists. |
April 21, 2025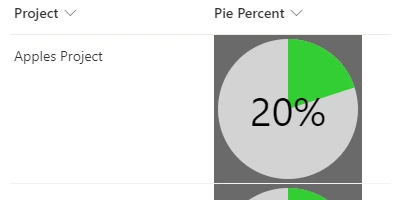
|
Show Date Countdown Indicator in SharePoint ListsAdd a template in your SharePoint lists to show the number of days until the due date. The Til Due KPI indicator at SharePointDashboards.com shows the number of days left before the date set in a due date column. Color coding is used to show whether the date is in the future, today or in the past. Additionally the number of days difference between the current date and date in the column in shown. This functionality is handy for keeping up with deadlines and avoiding being overdue on tasks. The Til Due KPI indicator is one of 21 free templates available at SharePointDashboards.com. Applying this template is easy to do and requires no custom coding. Just apply settings to control the appearance of the template then copy and paste to your SharePoint list date column. This is fast, easy and fun to use. |
April 20, 2025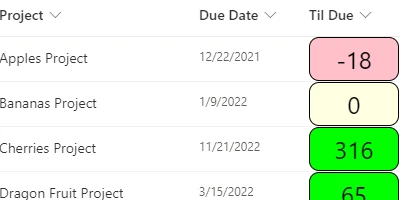
|
Add Priority Indicators to your SharePoint ListsA priority indicator is handy for showing when a SharePoint list record is high, medium or low priority. By color coding these priority levels, it makes it easy for users to identify important information. The SharePointDashboards.com Priority Bubbles template allows you to apply this visualization easily using your settings to control the appears of the priority column. This template is available for free along with 21 other SharePoint templates at SharePointDashboards.com. Apply this template using simple copy and paste directly to your SharePoint field. No programming is required. This template is easy to reuse on multiple lists helping you to identify when a record is high, medium or low priority. |
April 19, 2025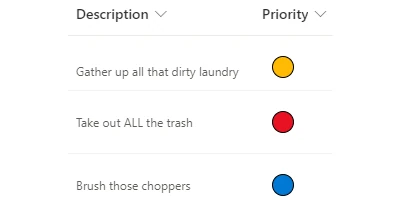
|
Show Status Icons in your SharePoint ListShow Microsoft Fabric icons on a status field in your Sharepoint list using the Status Fabric Icons template at SharePointDashboards.com. This template allows you to assign colors and icons to your SharePoint Status field to help in stand out making a beautiful looking SharePoint interface. Status Icons are useful as KPI indicators helping users easily see status by using symbols and colors. This approach is essential to visual project management dashboards. This template is easy to apply using simple copy and paste to your SharePoint list. Best of all no coding is required. Just set up your template with the style and color options you prefer then copy and paste your template to your SharePoint site. Fast, easy and fun! |
April 18, 2025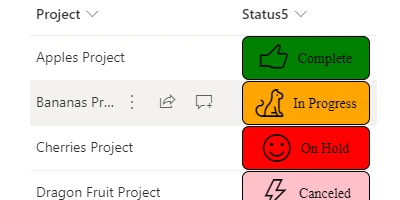
|
Show Google Maps Directly in SharePoint ListsGoogle maps can be used in SharePoint by using the SharePointDashboards.com Google Maps template. This allows you to show a mini map in SharePoint list views displaying a map of provided address information. Clicking on the map opens the browser to a full map. There are multiple configuration options to control the map size and style. Setting up this template is fast and easy. First set up a column to store an address or postal code in SharePoint and then apply this template to dynamically pull in a Google map for that location. Google Maps can be displayed for any part of the world. Best of all, no programming is required to take advantage of this functionality. Just copy and paste the template to your SharePoint list column and you are all set. Any time you have address information in your SharePoint list, the SharePointDashboards.com template will improve the user experience. |
April 17, 2025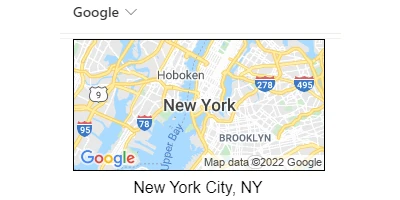
|
Add Color Coded Date Flags to your SharePoint ListsDates are often used in SharePoint lists to track deadlines and payment dates. Using the SharepointDashboards.com Date Flag Template it is possible to have dates automatically color coded with flag icons to show when a date is in the past, today or in the future. With this template it is easy to identify critical dates and avoid missed deadlines. This template is one of 21 free templates available at SharePointDashboards.com. Setting up the template is easy. Just pick your color and style choices then copy and paste the template to your SharePoint list column. After using all the free templates, you can access more 200 additional template options available on the site. The best part is that no programming is required. |
April 16, 2025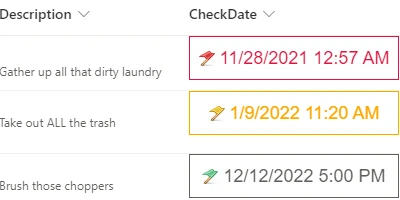
|
Add Stacked Flow Buttons to your SharePoint ListWhen you need to use many workflows with your SharePoint list, it is necessary to help users trigger Power Automate Flows easily. The Stacked Flow Button template at SharePointDashboards.com allows you to stack Flow buttons in a column which users can use to trigger different workflows in Power Automate. This template allows many Power Automate Flow buttons to appear in a column in your SharePoint list. This is the perfect way to allow your users to trigger workflow using easy to understand buttons instead of having to navigate through the command bar dropdown interface. Set up is easy. Just pick your icons, labels and colors for your buttons so users can easily understand each of the possible actions. Applying the template is easy. Just copy and paste the template to your SharePoint list column. |
April 15, 2025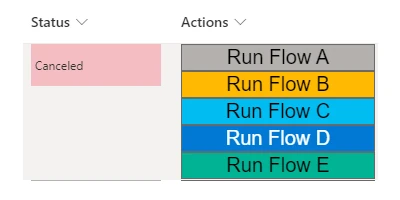
|
Trigger Power Automate Workflow from a SharePoint List ButtonSharePoint and Power Automate are used together to build complete SharePoint solutions. Adding a button to your SharePoint list to trigger Power Automate Flows helps to build interactive solutions. The SharePointDashboards.com Flow button template allows you to connect directly to Power Automate from your SharePoint list. Set up is easy. Just reference your Flow ID in the template settings then copy and paste the template to your SharePoint list column. Users are able to kickoff workflow in your SharePoint list with just one button click. The Flow Button template is available for free along with 21 other free templates. This template is a great way to provide complete interactive solutions directly from your SharePoint site. Sign up for a subscription to get access to more than 200 SharePoint Dashboard templates. |
April 14, 2025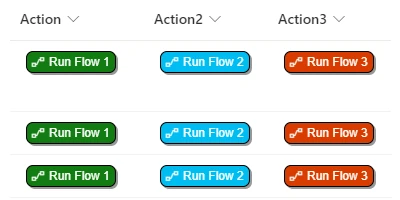
|
Add Rating Icons to your SharePoint ListAdding rating icons to your SharePoint list is a great way to improve the interface. A common scenario is having a rating from 1 to 5 stars. This template can be set to be interactive so that ratings can be adjusted directly from your SharePoint list view. Any kind of icons can be used. There are thousands of options to pick from. This could also be used to show an alarm level system. The scale can also be configured to go up to 10 if needed. This free template is available at SharePointDashboards.com along with 21 other free templates. Using this template only requires simple copy and paste to your SharePoint list. No coding is required. Make a great looking SharePoint Dashboard with this eye catching rating template. |
April 13, 2025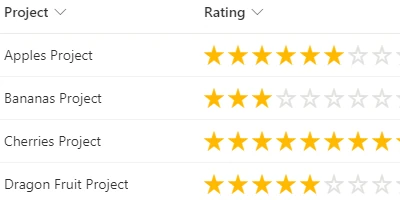
|
Show Document Thumbnail Previews in your SharePoint LibraryImprove your SharePoint libraries by adding a document preview thumbnail column to your view. This allows user to see an image previewing the first page of file. This is handy for all kinds of files including Word documents, Excel workbooks, PowerPoint presentations, PDFs, images and more. Clicking on the thumbnail allows users to open the file directly in SharePoint. Using a thumbnail preview image significantly improves the user experience by making it possible to see what is contained within documents before opening them. This template is available at SharePointDashboards.com for free along with 21 other free templates. Configure the template to change the appearance of your thumbnail image to look however you want. Just copy and paste the template to SharePoint without no coding required. |
April 12, 2025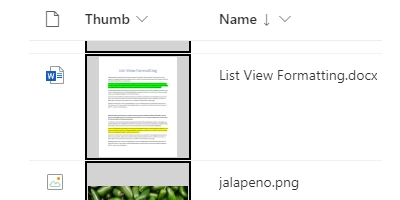
|
Add Custom Status Icon Indicators to your SharePoint ListUsing custom status icons is a great way to indicate status in your SharePoint lists. SharePointDashboards.com has hundreds of icons to choose from built directly into the interface. Set up you status icon template to look however you want including custom colors, font size, hover effects and more. Templates can be set up without having to do any coding. Just use the visual interface to make adjustments then copy and paste your template directly to your SharePoint list. Let users easily see different status values in your SharePoint list using these custom icons. The best part is how easy to use the templates are. Just copy the template and paste directly to SharePoint. There is never any programming required. |
April 11, 2025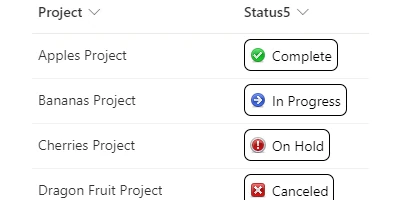
|
Add Interactive Checkboxes to your SharePoint ListsAdding a simple to use checkbox column to your SharePoint list can be done with just a few steps. If you want to be able to check and uncheck a checkbox directly in your SharePoint list then this is the perfect template for you. Applying this template requires simple copy and paste with no programming required. You can even adjust the styles to make your checkboxes look however you want including the use of creative icons and hover effects. This template is one of 21 free templates that you can access at SharePointDashboards.com. Sign up for your account to be able to use the 21 free started templates as much as you want. Adding a subscription unlocks more than 200 additional templates that you allow for a huge array of possibilities. If you like visualizing data in SharePoint lists then you will love these templates. |
April 10, 2025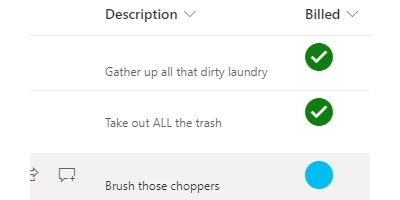
|
Add View Buttons to SharePoint Lists for Easy Form AccessThe View Button Template is one of the most popular and easy to use SharePoint JSON formatting templates. This template can be applied to a placeholder column in your SharePoint list so that users can open up the list record form with a single click. This button can be styled to look however you want including the use of hover colors and background shadow. The View Button Template is one of 21 free templates available at SharePointDashboards.com. You can sign up with just your name and email address to have unlimited access to these 21 free templates. Once you have taken advantage of these templates, upgrade to a subscription for more than 200 additional formatting templates. Best of all, no programming is required. Just copy, pasted and go! |
April 9, 2025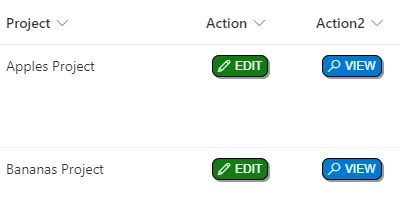
|
Make All SharePoint Lists Easy to Update with Edit ButtonsThe most commonly used JSON Formatting template in SharePoint is the Edit Button template. This allows you to add a simple edit button to your SharePoint list which users can click on to open the edit form for the selected list item. This template is handy to use with almost every SharePoint list. Setup for this template is easy to do since it only requires a placeholder column and simple copy and paste. You can style this button to look however you want using the provided template settings. Apply your own hover effect and even select from any of hundreds of Microsoft Fabric icons. This is helpful to apply to just about every SharePoint list that you make. This template is available as a part of 21 free templates available when you sign up for an account at SharePointDashboards.com. |
April 8, 2025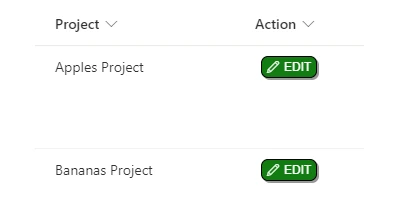
|
SharePoint Gantt Charts Made EasyGantt Charts are a great way to demonstrate overall project schedule. When tracking the progress of multiple projects you can easily see when projects are running concurrently with each other and plan your schedule and resources accordingly. Because SharePoint is such an effective platform to manage projects, it is a big improvement to add Gantt Charts to your SharePoint site. Using background colors on project bars can help improve the chart appearance allowing for color coding according to project status or project category. Gantt Charts are the best way to visualize overall project schedule in a single page that everyone can understand using a basic timeline concept. The only data needed for Gantt Charts are the project title, the project start date and the project end date. |
April 7, 2025
|
