Enhancing SharePoint Lists with Google Maps Integration
Organizations often resort to SharePoint for managing various datasets, which frequently include location-based information such as customer addresses, site locations, or travel destinations. In today's digital landscape, enhancing these datasets with visual aids can significantly improve information absorption and utility. One effective way to achieve this is by incorporating Google Maps directly into your SharePoint list views. The innovative approach of integrating Google Maps enhances not only the appearance of SharePoint lists but also their functionality. By using the Google Maps Card template available at
SharePointDashboards.com, users can create an interactive map feature that elevates the status and tracking capabilities of SharePoint lists.
Understanding SharePoint's Visualization Power
Incorporating visual elements into SharePoint has become essential for efficiently processing and understanding data. The Google Maps Card serves as a powerful tool within the realm of charting, visual status indicators, project management, employee management, and tracking systems. By displaying location information, SharePoint users can seamlessly track and visualize geographical data, offering a visual status of operations and logistics that is immediately accessible.
Integrating Google Maps takes these lists a step further, providing a dynamic map view that purely text-based descriptions lack. This integration transforms the standard list view into a robust, multi-functional asset. It enhances communicative precision in project and employee management, offering project managers a quick visual representation of project locations and logistical needs.
Setting Up the Integration: Simple and Configurable
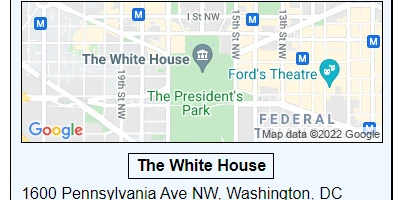
Deploying the Google Maps Card template to your SharePoint list is as straightforward as copying and pasting, thanks to
SharePointDashboards.com. By setting up this template, users can reference an address column within their SharePoint lists to display an interactive map. The template provides numerous configuration options allowing users to adjust the map's zoom level or select from a variety of map styles such as hybrid, satellite, road map, and terrain, thus customizing the map to meet organizational needs and preferences.
Practical Use Cases
Many scenarios illustrate the substantial benefits of adding this mapping functionality:
- Customer Relationship Management: Sales teams can use it to visualize customer distribution across geographic regions. Map visuals offer insights into regional sales performance and help identify target markets.
- Project Management: Project managers can track site locations, enhance planning logistics, and visualize project progress via map pins that show current and upcoming project sites.
- Employee Management and Tracking: HR departments can use maps to track employee deployment at various company locations or remote work arrangements, facilitating a visual overview of manpower distribution.
- Operational Logistics: Companies can manage delivery routes or field service territories, using visual maps to streamline field operations and improve route efficiency.
SharePoint JSON Formatting: Customizing List Views
To achieve such functionality, SharePoint JSON formatting comes into play. By applying a pre-designed template to a SharePoint list view, formatting can be effortlessly customized to include Google Maps. This simplification hides the complex coding behind JSON, enabling users to make substantial visual improvements with minimal effort.
JSON formatting in SharePoint empowers users to modify list view presentations by adding interactivity and visual elements, such as color-coded status indicators and, in this case, maps. Deploying the Google Maps Card template as a JSON design file means that anyone can transform a standard list into an interactive map-centric view without additional coding.
The Future of Interactive SharePoint Lists
The integration of Google Maps within SharePoint is a highly functional enhancement for any organization relying on geographic data. Beyond the ease of deployment, the significant changes it brings to visual and practical status reporting can redefine how organizations manage projects and data. By introducing this visually engaging component into SharePoint lists, companies can streamline their operational strategies, project monitoring, and employee oversight.
The combination of SharePoint's robust list management capabilities and the versatile visualizations enabled by Google Maps integration creates a dynamic information hub. It's not just about beautification; it's a pivotal step towards efficient project and resource management.
For organizations interested in upgrading their SharePoint lists, exploring
copy-and-paste templates represents an excellent starting point to embrace cutting-edge data visualization techniques. The resulting intuitive, data-driven decisions stemming from enhanced visual capabilities are bound to provide a competitive edge.