Understanding the Importance of Flow Charts in Business Processes
Flow charts serve as a pivotal tool in the effective understanding and communication of business processes. They offer a visual representation that simplifies complex systems into clear, digestible steps. This visualization is invaluable in many fields-from project management to employee management-where clarity and efficiency are paramount. But how can organizations integrate such powerful tools into their existing digital arsenal with ease? An ideal solution lies in SharePoint, specifically through a Flow Chart template from
SharePointDashboards.com.
Enhancing Charting with Flow Charts
Flow charts are essential in the domain of charting due to their ability to translate intricate processes into visual narratives. This transformation is vital for teams looking to grasp comprehensive workflows at a glance. In industries where precision and understanding are critical, flow charts act as blueprints that guide operations. By breaking down tasks into stages, they enable teams to see the bigger picture. This is crucial in sectors such as manufacturing, software development, or healthcare, where step-by-step procedures need strict adherence.
By utilizing the SharePointDashboards.com Flow Chart template, organizations can seamlessly integrate flow charts directly into their SharePoint infrastructure. This template allows users to visualize their processes directly from SharePoint lists with minimal effort. The tool is not only about creating diagrams but also about enhancing how status indicators and data visualizations inform decision-making.
Streamlining Visual Status Indicators
Visual status indicators are a vital component of any well-oiled project management system. They quickly convey the status of various tasks or projects, enabling managers to assess progress in real time. Flow charts, when used alongside these indicators, provide an enriched perspective, blending static data with dynamic representations of workflow.
Incorporating the Flow Chart template in SharePoint offers teams an opportunity to embed status indicators within their flow charts. By customizing elements like colors, fonts, and shapes, project managers can emphasize critical data points or denote progress, bottlenecks, and outcomes. This level of customization ensures that the flow chart not only communicates the process but also delivers real-time updates about project status.
Revolutionizing Project Management
Project management is inherently about steering processes to successful outcomes. Flow charts contribute heavily to this by mapping out each step of a project. They enable project managers to plan, execute, monitor, and control all aspects of a project with unparalleled clarity.
With the SharePointDashboards.com Flow Chart template, project managers can easily integrate detailed process maps directly into their existing SharePoint environments. This tool does not require technical expertise, as users can simply copy and paste the template into their SharePoint lists. It serves as a bridge between static project outlines and dynamic movement through project phases, ensuring that all stakeholders have a clear understanding of progress and areas needing attention.
Improving Employee Management and Tracking
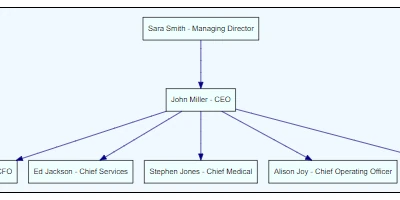
Flow charts are equally effective in the realm of employee management and tracking. By outlining task responsibilities and workflow, they help clarify roles within a team. Managers can track task completion and employee performance by having a transparent, visual representation of processes and responsibilities.
Utilizing the Flow Chart template in SharePoint, managers can quickly illustrate team structures, delineate tasks, and trace obligations. This isn't just about enhancing clarity but about empowering employees by ensuring everyone knows who is responsible for what, and how their tasks interconnect with others.
Setting Up Flow Charts in SharePoint
One of SharePoint's greatest strengths is its capacity for integration and customization. The Flow Chart template from SharePointDashboards.com taps into this capability by allowing users to construct rich, customizable flow charts directly from SharePoint lists. Here's how you can set this up:
- Visit SharePointDashboards.com.
- Download the Flow Chart template.
- Populate your SharePoint list with the necessary steps and configurations for your process.
- Copy the downloaded template.
- Paste the template into your SharePoint list, and watch as a detailed flow chart emerges.
Alternatively, with 21 free templates available on the site, teams can explore various options and find what works best for their specific needs.
The Role of SharePoint JSON Formatting
An instrumental part of introducing flow charts within SharePoint is SharePoint JSON formatting. This feature allows users to format their SharePoint list views to create visually compelling data presentations. By applying a JSON template to a SharePoint list view, organizations can turn raw data into engaging, informative dashboards.
JSON formatting acts as a bridge between the SharePoint data and the visual presentation, enabling users to apply the downloaded templates effectively. It unlocks a realm of customization-from altering display styles and color schemes to integrating interactive elements like flow charts. This flexibility ensures that companies can tailor visual presentations to their unique business environments.
Use Case Scenarios for Enhanced Understanding
To truly understand how powerful flow charts can be when integrated into SharePoint, consider these use case scenarios:
Scenario 1: Manufacturing Processes
A manufacturing company needs to track its production line. By using a flow chart in SharePoint, it can visually map out every step in its assembly process. This allows any production delays or quality assurance issues to be easily identified and addressed.
Scenario 2: Software Development
A software development firm can leverage flow charts for its project phases, detailing steps from planning to deployment. This helps track progress within teams and provides clarity for how individual tasks fit into the larger project scope.
Scenario 3: Customer Support
A customer support department can use flow charts to track ticket resolution workflows. By mapping out response procedures, management can ensure that all tickets are processed in a timely manner, identifying bottlenecks in the resolution process.
In conclusion, integrating flow charts into SharePoint using the Flow Chart template from SharePointDashboards.com revolutionizes how businesses visualize and manage processes. Through customizable, easy-to-implement templates, organizations can enhance clarity, improve project and employee management, and make more informed decisions. With such tools at your disposal, the complex becomes simple, and the abstract becomes tangible, fostering a more effective and transparent workflow.