Add Stacked Progress Bar Indicators in SharePoint Lists - April 22, 2025
Introduction to SharePoint Progress Bars
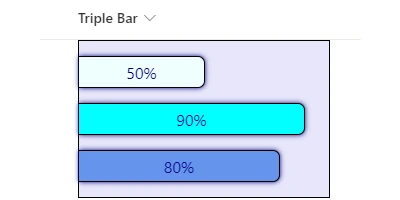
Progress bars are a fundamental visual tool used across various platforms to provide a quick, easily digestible representation of progress towards a goal. In the context of SharePoint dashboards, progress bars serve as an efficient means of displaying crucial data points succinctly. They translate numerical metrics into visual status indicators that can dramatically enhance understanding and communication within teams. Specifically, the SharePointDashboards.com Triple Progress Bar Template offers an innovative way to display multiple data streams within a single column, enhancing project and employee management capabilities.
The Role of Progress Bars in Charting and Visual Status Indicators
In the realm of charting, progress bars excel by simplifying complex data sets into clear visual representations. When you're comparing values that range from zero to a maximum, such as sales targets, project completions, or resource allocation, a progress bar can provide a quick snapshot of where things stand. By juxtaposing multiple bars within a single frame, users can immediately compare and contrast key performance indicators (KPIs) without needing to sift through complicated datasets.
Enhancing Project Management with Progress Bars
Project management demands clarity and conciseness, particularly when it comes to tracking the status of multiple tasks. Progress bars facilitate this by offering managers and team members a quick overview of progress. The Triple Progress Bar Template is particularly beneficial as it allows for the simultaneous display of three different metrics. For instance, in a project scenario, you could have one bar showing the overall project completion percentage, another indicating the number of tasks completed, and a third reflecting the budget spent. This triple-tiered approach enables stakeholders to gain a comprehensive view of the project's status at a glance.
Employee Management and Tracking
Employee performance tracking can be significantly streamlined with progress bars. By assigning a progress bar to individual employees or teams, management can easily monitor progress against specific objectives. For instance, a bar may represent the progress toward a sales target, while another could reflect the completion of professional development goals. This visual tool not only aids managers in making informed decisions but also empowers employees with a clear understanding of their performance metrics.
Implementing Progress Bars in SharePoint
SharePoint, a powerful tool for collaboration and project management, can be greatly enhanced with the use of progress bars. Thanks to platforms like SharePointDashboards.com, implementing these tools is straightforward. The Triple Progress Bar Template can be customized to fit specific needs through simple style adjustments. Users can effortlessly integrate this template into their SharePoint site by copying the preset code and pasting it into their system. This intuitive method requires no advanced programming skills, making it accessible for users of all technical backgrounds.
Use Case Scenarios for Progress Bars
To understand the practical utility of progress bars, let's consider some fictional use cases:
1. Marketing Campaign Tracking: A marketing team can leverage the Triple Progress Bar to visualize email campaign progress, ad spend, and lead conversion rates all in one view, allowing for quick adjustments to strategy based on which areas lag behind.
2. Product Development: In a product development scenario, teams can use this tool to track prototype completion, testing phases, and budget usage, ensuring they stay on time and within financial constraints.
3. Financial Forecasting: Financial analysts could use progress bars to compare year-to-date revenue against forecasts and adjust projections and strategies accordingly.
Understanding SharePoint JSON Formatting
SharePoint's flexibility is further magnified through JSON formatting, a scripting language that enables the customization of list views. By applying a SharePoint list view template, users can transform standard data columns into dynamic visual indicators like progress bars. This transformation process involves applying a JSON formatted template to the list view, which dictates the visual settings for each progress bar, including color coding, size, and threshold values. This capability allows organizations to tailor their dashboards specifically to their operational needs, thus enhancing data visibility and decision-making processes.
Conclusion
Incorporating progress bars into SharePoint dashboards represents a strategic enhancement to data visualization and management. The SharePointDashboards.com Triple Progress Bar Template stands out as an effective tool for tracking multiple KPIs simultaneously, thereby promoting informed decision-making and boosting efficiency across projects. Whether for project management, employee tracking, or broader organizational oversight, this implementation aids in achieving clarity and efficiency in communication. By utilizing accessible tools such as SharePoint JSON formatting, organizations can customize their dashboards to fit specific needs without the need for complex coding, making it an invaluable resource for users at all technical skill levels.
|
