Introduction to Area Charts
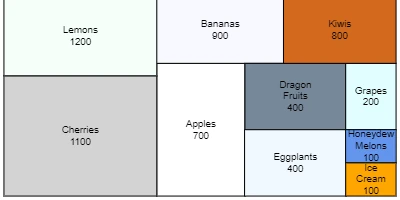
Area Charts are a compelling visual alternative to the frequently used Pie Charts in data visualization. Both chart types display data in proportional shapes, but Area Charts offer a different aesthetic and functional utility by using rectangles instead of pie wedges. This creates a more streamlined and often clearer representation of data that can be highly effective when integrated into project management and employee tracking systems.
The Utility of Area Charts in Data Visualization
Area Charts hold a distinct advantage in their ability to represent data proportions in a visually straightforward manner. This format is particularly valuable when displaying comparative data across various sectors or phases of a project. By leveraging rectangles to denote different values, Area Charts become a versatile tool for showcasing changes over time or differences across categories. The clean lines and structured layout make it easier to spot trends and identify disparities in datasets instantly.
Integrating Area Charts in SharePoint
Incorporating Area Charts into a SharePoint site is a seamless process thanks to platforms like
SharePointDashboards.com. By copying and pasting a template directly into SharePoint, users can quickly deploy an Area Chart, enriching the site's data visualization capabilities. This integration not only supports better data comprehension but also enhances collaborative capabilities by providing team members with up-to-date visual status indicators for ongoing projects.
Customization Options
SharePointDashboards.com offers numerous customization options for Area Charts, allowing users to tailor the appearance of their charts to meet specific needs. Various settings can be adjusted, including:
- Colors: Customize the color palette to match corporate branding or differentiate between data sets.
- Borders: Define border styles to enhance visual delineation between chart segments.
- Fonts: Choose from a selection of fonts to ensure text legibility and aesthetic coherence.
- Sizing: Adjust the size of the chart to fit seamlessly within your SharePoint site layout.
These options ensure that Area Charts are not just informative but also visually congruent with the overall site design.
Application in Project Management
In project management, Area Charts offer a practical solution for monitoring and displaying project progress and resource allocation. For instance:
Use Case 1: Resource Allocation
Area Charts can visually represent the distribution of resources across various departments or project phases. By using rectangles proportionate to the value being allocated, project managers can immediately discern where resources are concentrated and where reallocations may be necessary.
Use Case 2: Milestone Tracking
Project milestones can also be effectively tracked through Area Charts. Displaying completed tasks against pending ones in an area format provides a clear picture of project progress and deadlines.
Use Case 3: Risk Management
Area Charts can assess and communicate the impact of potential risks visually. Different risk factors can be represented as rectangles of varying sizes according to their impact level, enabling quick risk assessment and responsive action planning.
Area Charts in Employee Management
For human resource management, Area Charts are instrumental in tracking employee metrics such as performance, attendance, and workload distribution. For example:
- Visualizing team performance variations over time can guide managers in identifying high-performing employees or teams that require additional support.
- Attendance patterns can be depicted to spotlight areas of concern or seasonal trends in absenteeism.
- The workload distribution can show whether tasks are evenly spread across teams or if specific individuals are overburdened.
Creating Area Charts with SharePoint JSON Formatting
The process of creating an Area Chart in SharePoint often involves JSON formatting-a lightweight data interchange format that is easy to read and write. By applying a template from SharePointDashboards.com to a SharePoint list view, users can develop customized data visualizations without the need for intricate coding knowledge. JSON can format and style charts dynamically, ensuring data representation is both precise and customizable.
Conclusion
Area Charts offer an innovative and adaptable approach to data visualization that seamlessly integrates into SharePoint. Whether you aim to track project progress, manage employee performance, or present risk assessments, Area Charts make data comprehension swift and intuitive. By utilizing the templates provided by platforms such as SharePointDashboards.com, organizations can harness the full potential of these charts using the customizable features to align with their branding and reporting requirements. This blend of functionality and customization ensures Area Charts remain a powerful tool in the arsenal of any data-driven enterprise.