Enhancing Project Management with Visual Progress Indicators in SharePoint
Progress indicators play a pivotal role in project management and tracking, providing clear, instant visualization of task completion and overall project status. In platforms like SharePoint, these indicators can significantly enhance the way tasks and projects are monitored. Among the various tools available, the Radial Gauge indicator sourced from
SharePointDashboards.com stands out as a dynamic solution for emphasizing progress in SharePoint lists.
Integrating Progress Indicators in SharePoint
Utilizing progress indicators in SharePoint serves multiple purposes. First and foremost, it provides a clear visual representation of status, allowing managers and team members to quickly assess the state of tasks and projects at a glance. Such visual aids are crucial for effective project management as they ensure critical information does not get lost amidst the myriad of project data.
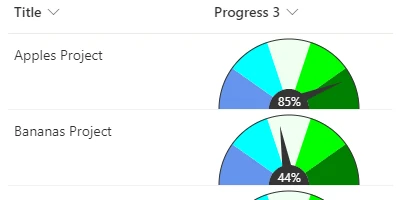
The Radial Gauge indicator is an exceptional tool available on SharePointDashboards.com. It's designed to make progress data more accessible and visually engaging. This template is not only functional but also highly customizable, allowing users to adjust colors and styling to their preferences, thereby aligning with their organizational branding.
Simple Setup with Copy and Paste Templates
One of the Radial Gauge template's primary advantages is its ease of use. Setting up involves merely copying and pasting from the SharePoint Dashboards site into a SharePoint list. This simplicity eliminates the need for complex coding or design expertise, making it widely accessible to SharePoint users with varying technical skills. By simply applying this template to a number column with values ranging from 0 to 100, users can effectively track progress with vivid visual indicators.
Applications in Charting and Project Management
Incorporating progress indicators like the Radial Gauge in SharePoint can greatly enhance charting and overall project management workflows. Here are some key use cases:
- Task Management: Visual indicators can highlight which tasks are nearing completion and which require additional attention, aiding in prioritization and resource allocation.
- Project Tracking: Managers can instantly see project status and progress, facilitating more informed decision-making and timely intervention if projects are at risk of falling behind.
- Employee Performance: Individual and team performance can be visually monitored, allowing for transparent tracking of contributions and areas for improvement.
- Resource Management: Progress indicators can help identify resource bottlenecks, ensuring that projects have the necessary support to move forward efficiently.
Employee Management and Tracking
Beyond charting and project management, progress indicators also serve in employee management and tracking. By visually demonstrating task completion status, employees can self-assess their performance, promoting accountability and motivation. Managers can better distribute tasks based on team capacity and capability, ultimately optimizing overall workforce efficiency.
Setting Up SharePoint JSON Formatting
JSON formatting is a powerful tool in SharePoint, enhancing list views with custom styles. Applying a JSON template, such as the Radial Gauge, modifies the appearance of list data without altering the underlying information. This process involves downloading the template from SharePointDashboards.com and embedding it in a SharePoint list view, effectively transforming numerical data into compelling visual graphics.
Getting Started with SharePoint Dashboards
SharePointDashboards.com offers a comprehensive suite of templates, including the Radial Gauge. With a variety of options, users can select a format that best suits their needs. By signing up, users can access 21 free templates, providing a gateway to a broader toolkit for enhancing SharePoint lists. Whether for tracking project milestones or managing employee tasks, these templates present an invaluable asset for any organization looking to leverage SharePoint's capabilities.
In conclusion, the integration of visual progress indicators like the Radial Gauge into SharePoint represents a significant leap in optimizing project management and employee tracking. The simple implementation process, combined with customizable options, empowers organizations to transform how they represent and utilize data, ensuring that key project insights are always within easy reach.