Setting Up Stacked Bar Charts in SharePoint: A Comprehensive Guide
In today's fast-paced business environment, visual representation of data is more crucial than ever. Stacked bar charts, in particular, allow for a clear depiction of aggregated totals across various categories. However, when it comes to using SharePoint out-of-the-box tools, setting up such charts can be challenging, if not outright impossible. Typical alternatives, meanwhile, often come with a hefty price tag and a considerable learning curve. Fortunately,
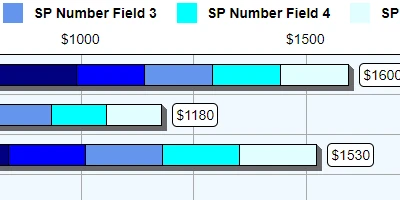
SharePointDashboards.com provides a user-friendly and cost-effective solution with their easy-to-use stacked bar chart template specifically designed for SharePoint lists.
The Importance of Charting in Modern Business
Visual aids like stacked bar charts play a pivotal role in project and employee management. They serve multiple purposes, including:
- Charting: Offering a visual snapshot of data, making complex information easier to comprehend.
- Visual Status Indicators: Allowing stakeholders to quickly assess the current status and identify any issues that may need addressing.
- Project Management: Assisting in tracking project progress against goals, deadlines, and budgets.
- Employee Management: Facilitating the monitoring of employee activities, workloads, and performance metrics.
- Tracking: Enabling real-time data tracking to ensure company operations remain on target.
Easy Deployment with SharePointDashboards.com
Deploying the stacked bar chart involves an incredibly simple process. There's no need for extensive programming knowledge; it's a simple copy-and-paste endeavor. Users only need to provide the names of their desired fields from the SharePoint list and adjust the visual elements of the chart to match their preferences. This flexibility allows for customized chart appearances that align with organizational branding or personal taste.
Utilizing SharePoint JSON Formatting
JSON (JavaScript Object Notation) formatting in SharePoint is a method for applying special formatting to SharePoint list views. By leveraging SharePoint JSON formatting, you can apply a predesigned template to your list view, transforming standard data entries into visually appealing charts. This process empowers your SharePoint environment by converting raw data into comprehensive visual insights without delving into complicated coding processes.
Case Scenarios for Stacked Bar Charts
Stacked bar charts can be integrated into various workplace scenarios to enhance data visibility and operational efficiency. Here are a few ways in which they can be implemented:
Project Progress Tracking
Project managers often rely on stacked bar charts to track phases of a project against time and resources. By using different colors to represent completed and pending tasks, managers can quickly assess how much work lies ahead. This is particularly effective in agile environments where projects evolve rapidly and require ongoing adjustments.
Resource Management
Effective resource allocation is key in preventing project bottlenecks. Stacked bar charts provide a visual representation of employee involvement across different tasks or projects, allowing team leaders to adjust workloads to prevent burnout and ensure balanced resource distribution.
Sales Performance Analysis
In a sales environment, stacked bar charts can differentiate between sales performance across regions, product lines, or time periods. Decision-makers can use these insights to strategize enhancements in sales tactics and better align marketing efforts with observed trends.
Getting Started with SharePoint Dashboards
For those eager to explore these benefits, getting started is a breeze with SharePointDashboards.com. Users can sign up for free access to 21 assorted templates using just their name and email address. With over 35 charting templates available, the tool offers a variety of options tailored to different data visualization needs, empowering businesses to communicate data with unparalleled clarity.
Conclusion
The importance of data visualization cannot be overstated. As organizations grow increasingly data-driven, tools like stacked bar charts become vital in maintaining clarity and facilitating informed decision-making. SharePointDashboards.com simplifies this process with their seamless integration into SharePoint lists, eliminating the need for expensive, complex alternatives. By making use of their easy-to-deploy templates, businesses can transform their data visibility and overall workflow efficiency. Whether for project management, employee supervision, or performance tracking, stacked bar charts in SharePoint offer a streamlined approach to data excellence.