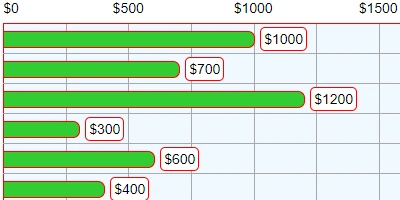
Introduction to Bar Charts in SharePoint
Bar charts have always been the cornerstone of data visualization due to their simplicity and effectiveness in presenting information. Whether displaying sales performances, project progress, or resource allocations, bar charts offer a clean and straightforward method to interpret complex data. A common platform where business professionals seek to implement such insightful graphical representations is SharePoint. However, one of the critical drawbacks of SharePoint is its limited built-in bar chart capabilities. Fortunately, these limitations can be overcome with the advanced bar chart template available on
SharePointDashboards.com. This resource opens up a world of customization and precision that fits perfectly into various business needs.
Importance of Visual Status Indicators in Project Management
In project management and employee management contexts, the necessity of clear visual status indicators cannot be overstated. Bar charts serve as an excellent tool for this purpose by offering a visual summary that expedites decision-making processes. They provide an overarching view of project timelines, resource management, and task completion statuses. Managers can easily determine areas that require urgent attention, and team members can view their own progress in relation to the project goals. When operational with flexibility and customization, bar charts can precisely reflect the subtle nuances of project dynamics.
With SharePointDashboards.com's bar chart template, these indicators can be fine-tuned to perfectly reflect specific project metrics. These templates ensure that each bar chart produced is not only an embodiment of data but also an intuitive tool for insightful analysis.
Customizing Bar Charts Using SharePointDashboards.com
While traditional bar charts offer limited options, the configurations made available through the
SharePointDashboards.com template transform what could be a basic representation into a robust visualization tool. This customization can include:
- Color coding for instant data interpretation
- Legend and label options for clarifying information
- Axis adjustment for more precise data scaling
- Inclusion of trend indicators and benchmark lines
One of the greatest benefits of using this template is the real-time preview feature, which allows users to visualize changes as they make adjustments. Managers and teams can be assured that what is being produced is exactly what is needed to fit their unique circumstances. The completed chart can then be effortlessly integrated into a SharePoint list with a simple copy-paste action.
Use Cases and Scenarios for Bar Charts in SharePoint
Bar charts are versatile tools, and their application varies across different scenarios in professional environments:
Project Tracking: Using bar charts, project managers can track project timelines and deliverables more effectively. This can include insight into the duration of tasks, which allows better allocation of resources and planning of project stages.
Sales Performance: For sales teams, bar charts offer an easy way to visualize performance metrics across different products or services. This can help identify high-performing sales strategies and areas needing improvement.
Resource Management: Bar charts can effectively display resource allocation, helping managers to ensure balanced distribution across various departments or projects, thereby optimizing the workflow.
Employee Productivity: By visualizing employee workloads, managers can ensure that no team member is overburdened, fostering a conducive work environment and maintaining a balanced workflow.
Setting Up SharePoint Bar Charts: JSON and Templates
SharePoint's flexibility allows users to leverage JSON formatting for transforming list views into comprehensive data visualizations. The bar chart templates from
SharePointDashboards.com utilize JSON formatting to customize list data into powerful visual aids. By applying a template to a SharePoint list view, users are not only able to present data better but also customize how it is experienced by the viewer.
This capability is crucial for organizations seeking to enhance their data presentation without the need for intricate technical expertise. By using structured JSON files formatted specifically for various visualizations, such as bar charts, users can apply consistency across multiple data lists or dashboards without reinventing the wheel each time.
Integrating Charting Solutions in SharePoint
Affordable and Easy: SharePointDashboards.com presents a practical solution for those who need robust charting on SharePoint without breaking the bank. The array of chart options provided, including the bar chart, make it convenient for organizations of all sizes to visually enhance their data.
With the inclusion of over 35 different chart options, organizations are not limited to bar charts alone. They can explore diverse ways to depict data for various applications, ensuring that the most appropriate visualization method is employed. SharePoint's integration with these templates supports a dynamic business environment where data presentation is as critical as the data itself.
In conclusion, by leveraging the advanced bar chart templates available at SharePointDashboards.com, businesses can transform their data management and visualization capabilities in SharePoint. With easy setup and extensive customization options, these tools facilitate improved project management, performance tracking, and decision-making processes across a myriad of business scenarios.


