Enhancing SharePoint Capabilities with Polar Charts
SharePoint is an incredibly versatile platform widely used for collaboration, document management, and workflow automation. Despite its strengths,
SharePoint provides almost no charting capabilities out of the box, leaving many users desiring more when it comes to visualizing data. Fortunately, there is a solution that fills this gap: SharePointDashboards.com provides templates that can add up to 35 different kinds of charts to your SharePoint lists. One of the most eye-catching and effective among these is the Polar Chart.
The Uniqueness of Polar Charts
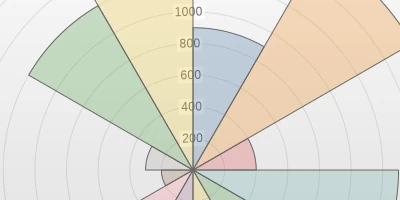
The Polar Chart offers an interesting twist on the all-too-common pie chart by transforming how data is visually represented. Instead of static circular wedges, the data points in a Polar Chart scale outward from a central point, creating a dynamic visual effect that is both distinct and captivating. This scaling feature highlights variations between data metrics more clearly than traditional pie charts can. Using a Polar Chart can make your data visualization stand out, capturing attention and making complex data trends easier to understand.
Seamless Integration with SharePoint
Integrating a Polar Chart into your SharePoint site is straightforward and user-friendly. With a simple copy and paste from SharePointDashboards.com, you can quickly incorporate one of these visually compelling charts into your work environment. The process begins by configuring the appearance of the chart on the SharePoint Dashboards setup screen. Once configured to meet your preferences, the chart is ready for deployment. This level of ease makes SharePointDashboards.com an invaluable tool for those looking to augment their data visualization capabilities without delving into complex programming or investing in expensive tools such as Microsoft Power BI.
Charting and Visual Status Indicators
Enhancing data representation through Polar Charts significantly contributes to charting and visual status indicators. These elements are crucial in project management, employee management, and performance tracking. Polar Charts offer a comprehensive and immediate visual understanding of project progress or task distributions, eliminating the need to sift through dense numerical reports.
By visually representing data, management can quickly assess statuses and distributions, allocate resources efficiently, and recognize potential issues or successes at a glance. This is particularly useful in:
- Project Management: Offering visual tracking of task completion ensures project timelines are met.
- Employee Management: Highlighting performance data in a visual format can lead to more meaningful performance reviews.
- Tracking Progress: Progress on long-term projects or goals can be more effectively displayed, enabling stakeholder engagement.
Setting Up in SharePoint Using Templates
The beauty of SharePointDashboards.com templates is their simplicity. By offering pre-designed chart templates, users can bypass the need for custom coding. The setup process becomes as easy as copying a chart configuration from the SharePoint Dashboards interface and pasting it into the desired section of your SharePoint site. This simplicity saves valuable time and resources, freeing users from the technical complexities often associated with customizing SharePoint.
Utilizing SharePoint JSON Formatting
A crucial aspect of customizing SharePoint lists involves SharePoint JSON formatting, which allows for advanced visual modifications of list views. With JSON formatting, users can manipulate the appearance of list columns by using a descriptive JSON script. SharePointDashboards.com leverages this feature by enabling users to apply a template to a SharePoint list view, which instantly enhances its aesthetic appeal and functionality.
When applying JSON formatting, the template adjusts list items' display using specific rules that align with your visual preferences. This streamlined process showcases the list information in a way that is visually engaging and contextually informative.
Use Case Scenarios
To better demonstrate how the Polar Chart can be leveraged in SharePoint, consider the following use case scenarios:
- Marketing Campaign Analysis: A marketing team could utilize a Polar Chart to visually display the effectiveness of various social media campaigns. The chart could show engagement levels, conversion rates, and reach, enabling the team to make data-driven decisions about future campaigns.
- HR Management: The HR department could employ Polar Charts to track employee training sessions, visually comparing the completion rates across different departments. This provides a clear snapshot of training engagement, helping to tailor future programs more effectively.
- Sales Performance Tracking: A sales team might use Polar Charts to compare monthly sales performances against targets and across different regions. This visual tool helps identify trends and motivates teams by visually emphasizing areas of success or concern.
Conclusion
Incorporating Polar Charts into SharePoint through SharePointDashboards.com presents a significant enhancement to the platform's capabilities. By enabling users to easily create visually compelling data representations, these tools foster improved understanding, facilitate better project management, and enhance overall organizational efficiency. Whether you're visualizing sales data or tracking project milestones, the ease and flexibility offered by Polar Charts and SharePointDashboards.com make them indispensable in transforming how data is interacted with in your organization.