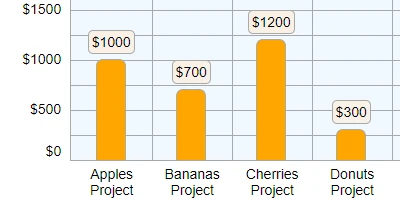
Visualizing Data in SharePoint with Bar Charts
Visualizing data effectively is crucial for informed decision-making and efficient project management. Bar charts, as one of the most accessible and popular forms of data visualization, are essential tools for any organization that relies heavily on data. In the context of SharePoint, which is renowned for its flexibility in document management and collaborative capabilities, bar charts represent a compelling way to track project progress, employee performance, and more. However, implementing bar charts in SharePoint has traditionally been a challenging task without additional third-party tools. While Power BI stands out as a potential solution, its cost and complexity make it a less viable option for many users. Instead, SharePointDashboards.com offers an easy-to-use and affordable charting platform that leverages over 35 different kinds of charting templates.
The Power of Bar Charts in SharePoint
Bar charts are instrumental in displaying categorical data, making it easier to compare different groups. They are particularly useful for charting visual status indicators, which add an element of clarity to progress tracking and employee management. With bar charts, you can easily identify trends, outliers, and areas that require attention, which can be especially valuable for project management. Seeing data visually represented in real-time can significantly enhance decision-making, operational efficiency, and employee productivity.
Integrating Bar Charts into SharePoint
For many organizations, SharePoint serves as a hub for document management, content organization, and team collaboration. Its extensive range of functionalities already supports file sharing, project tracking, and communication, thereby creating a comprehensive ecosystem for operational needs. Adding the ability to visualize data through bar charts without having to depend on Power BI or expensive developers can transform how teams analyze data and track progress.
Affine Ease with SharePointDashboards.com
SharePointDashboards.com fills a critical gap by providing a simple, cost-efficient, and accessible charting solution. This platform offers more than 35 different charting templates, which means there is a strong likelihood of finding exactly the kind of chart you need to represent your data effectively. Most importantly, the entire process is user-friendly, requiring no coding expertise. Users simply need to select their desired configuration options to customize the appearance of their bar chart. Once satisfied with the preview, they can easily copy and paste it directly into their SharePoint list.
Cost Efficiency Compared to Power BI
Whereas Power BI necessitates separate user licenses for everyone who views a chart, SharePointDashboards.com requires only a single license for the user creating the charts. This cost-saving feature is especially attractive for organizations aiming to keep expenses in check. Moreover, by eliminating the need for every team member to hold a license, financial resources can be reallocated to other essential areas of the business.
Implementing JSON Formatting in SharePoint
For those who are more technically inclined, SharePoint offers JSON formatting to configure how fields and list views appear in SharePoint lists. By applying a JSON template, users can tailor list views to better meet organizational needs. SharePointDashboards.com simplifies this process even further-once you've applied a bar chart template from their website, it's a matter of replacing placeholder content with your own data. This enables swift deployment while maintaining a high degree of flexibility to customize the appearance and functionality of your data visualization.
Use Case Scenarios for SharePoint Bar Charts
In terms of practical application, organizations can leverage SharePoint bar charts in various scenarios:
- Employee Performance Management: Utilize bar charts to compare the performance metrics of different employees or teams. This can aid managers in recognizing exceptional performance and identifying areas that need improvement.
- Project Progress Tracking: Bar charts provide a clear representation of completed tasks versus the planned ones. This helps project managers to assess whether a project is on schedule or if corrective actions are necessary.
- Financial Reporting: Use bar charts to break down budget allocations and expenditures, making it simpler to oversee financial health and manage budgets more effectively.
- Sales Analysis: Plot sales data across different periods, product lines, or geographic locations to identify trends and inform strategy development.
- Resource Allocation: Quickly visualize and manage resources across multiple projects. Determine where resources are over-allocated and where they are underutilized.
Getting Started with SharePointDashboards.com
Getting started with SharePointDashboards.com is straightforward. A simple sign-up gives users access to 21 free templates, enabling them to test out the platform and understand its capabilities before committing further. From there, users can explore the more than 35 different charting templates to find those that best fit their specific needs, tailoring configurations to achieve the desired appearance for their bar charts.
Conclusion
In today's data-driven world, the ability to visualize data efficiently and effectively is a necessity, not a luxury. Bar charts in SharePoint provide an invaluable resource, transforming raw data into accessible insights. While Power BI is an option for organizations with extensive budgets and specialized users, SharePointDashboards.com offers an equally potent but more cost-effective alternative. By enabling easy-to-create bar charts with a user-friendly interface and no programming skills required, SharePointDashboards.com ensures that all organizations, irrespective of size, have access to the critical insights they need to remain competitive and efficient. Whether tracking project progress, managing employee performances, or conducting financial analysis, the ease and affordability of SharePointDashboards.com's tools make them an ideal addition to any SharePoint environment.


