×
|
×
|
|
1 Minute Training » Click green box below.

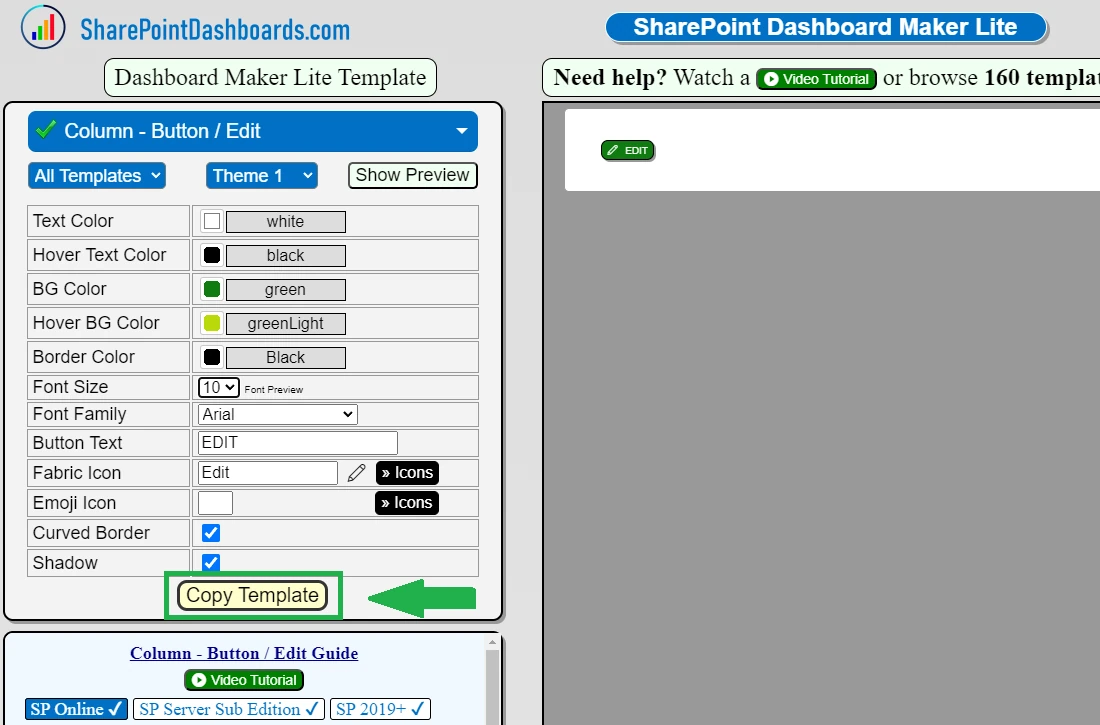
This is a Pro Template. » Upgrade to get template code.
Preview the template features by updating settings on the left. » Return to the Gallery to browse other templates.
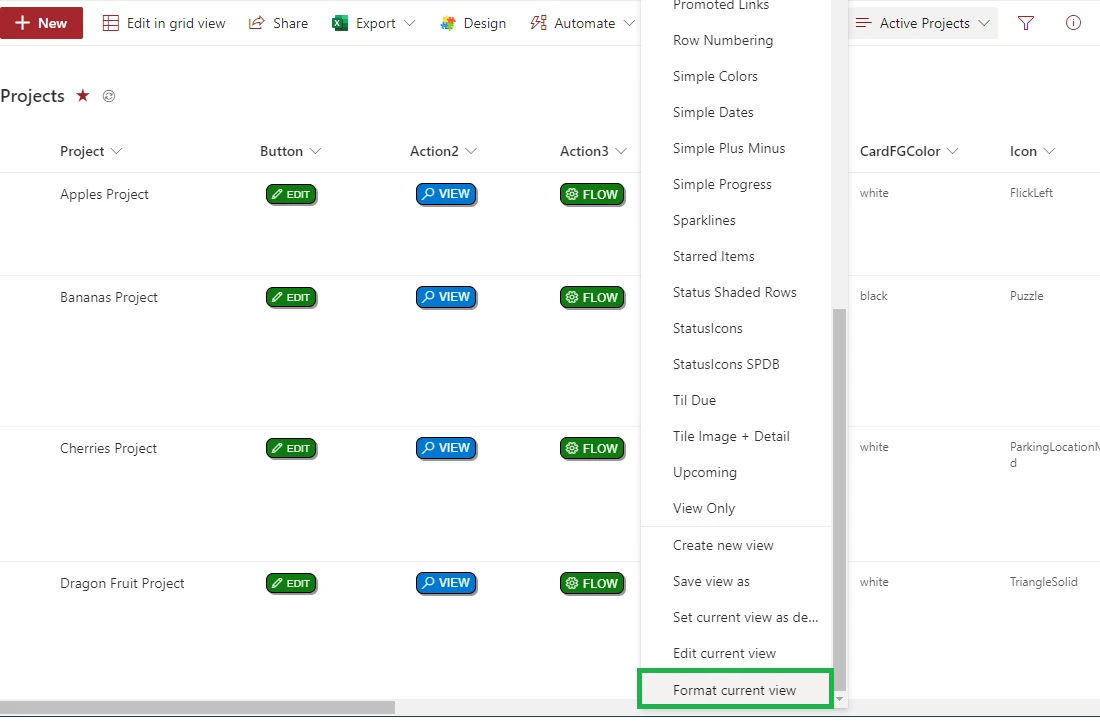
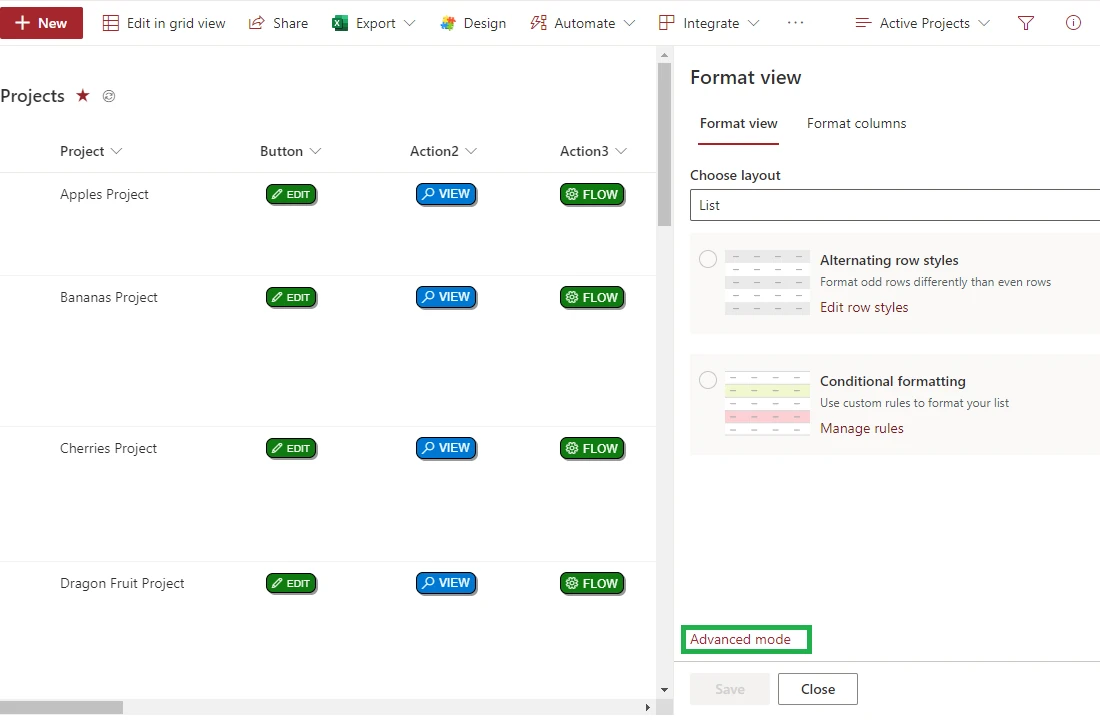
Not sure what to do? Follow the instructions here:
» Return to the Gallery to browse other templates
Please sign in to access this template.
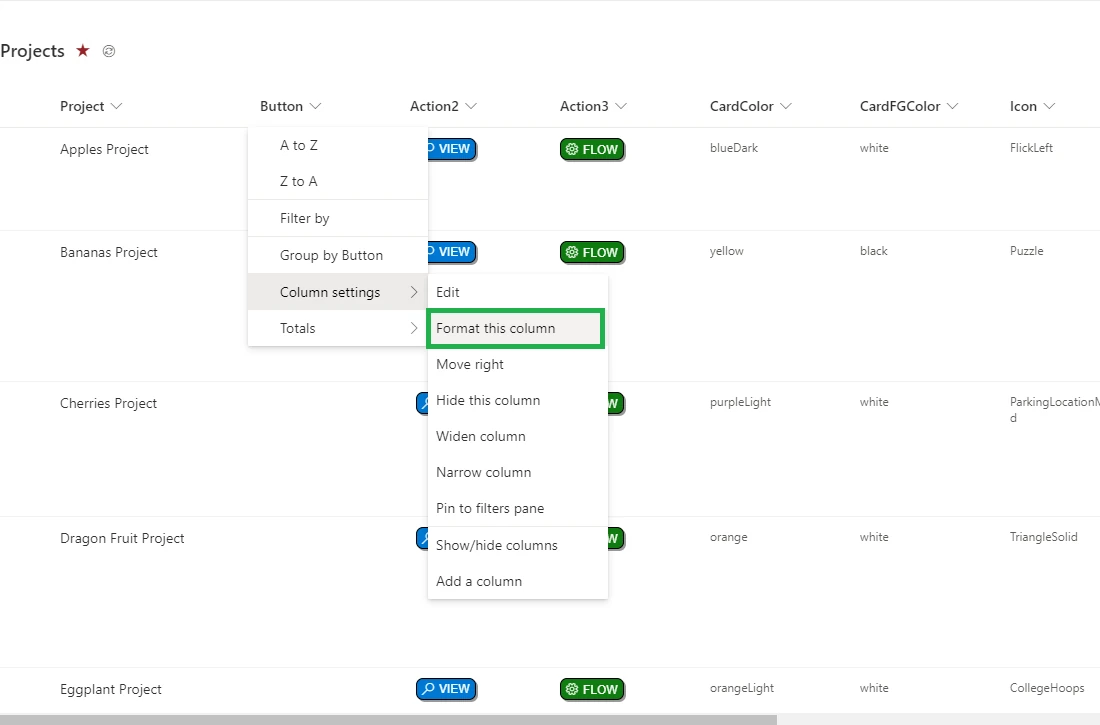
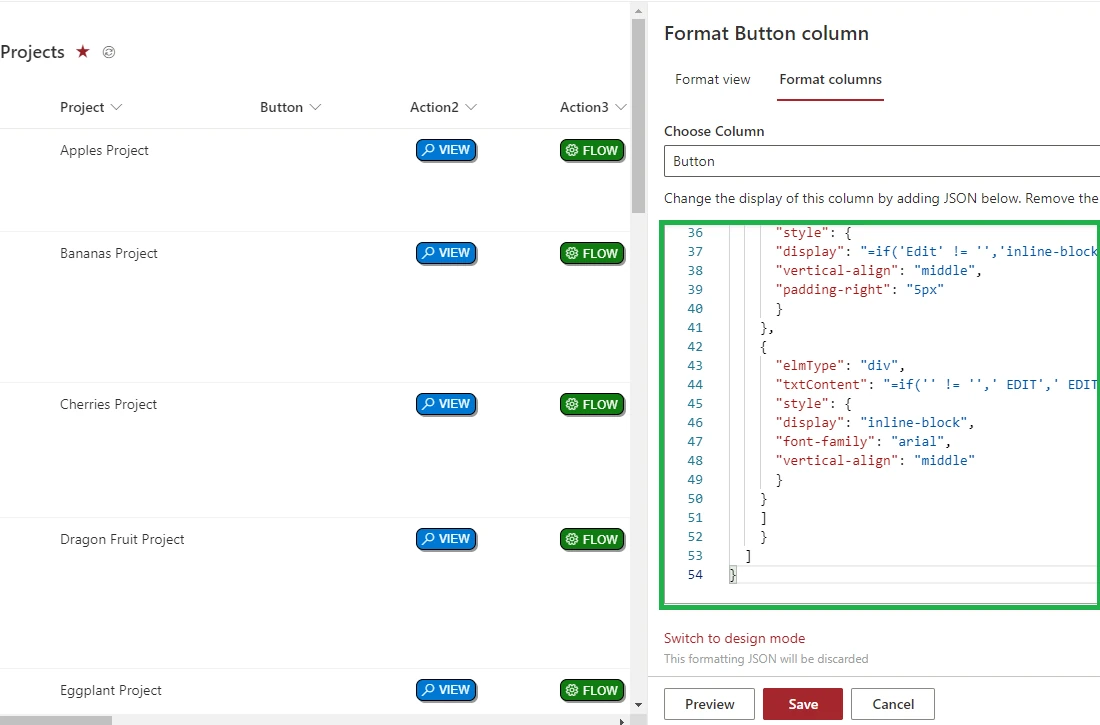
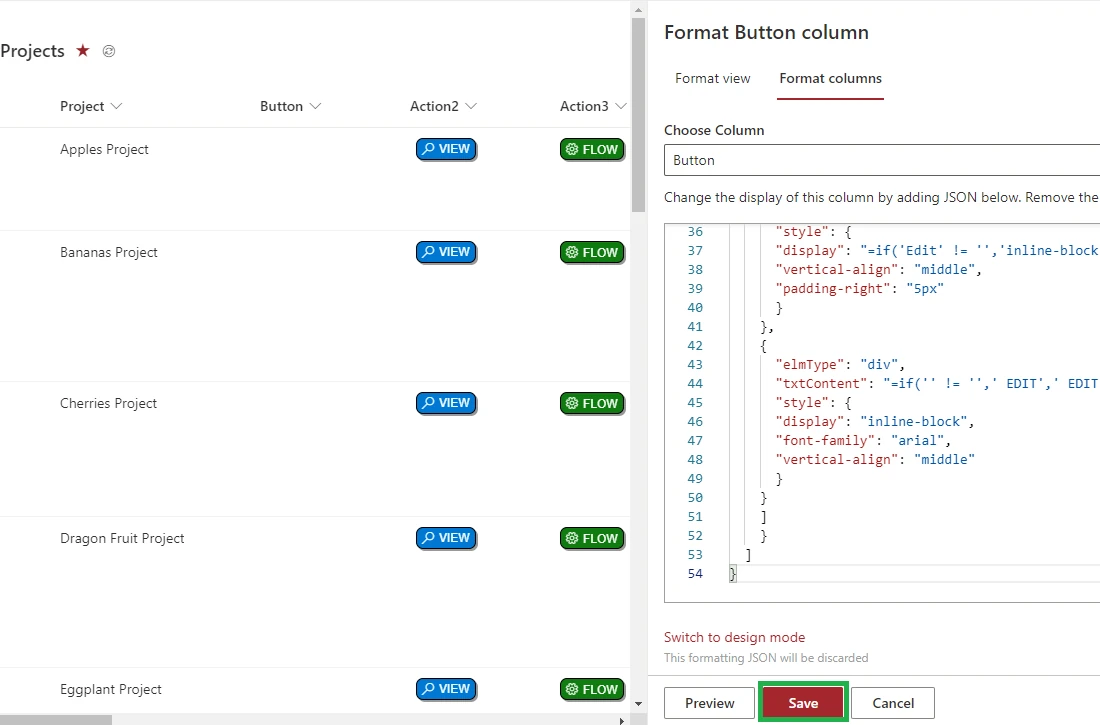
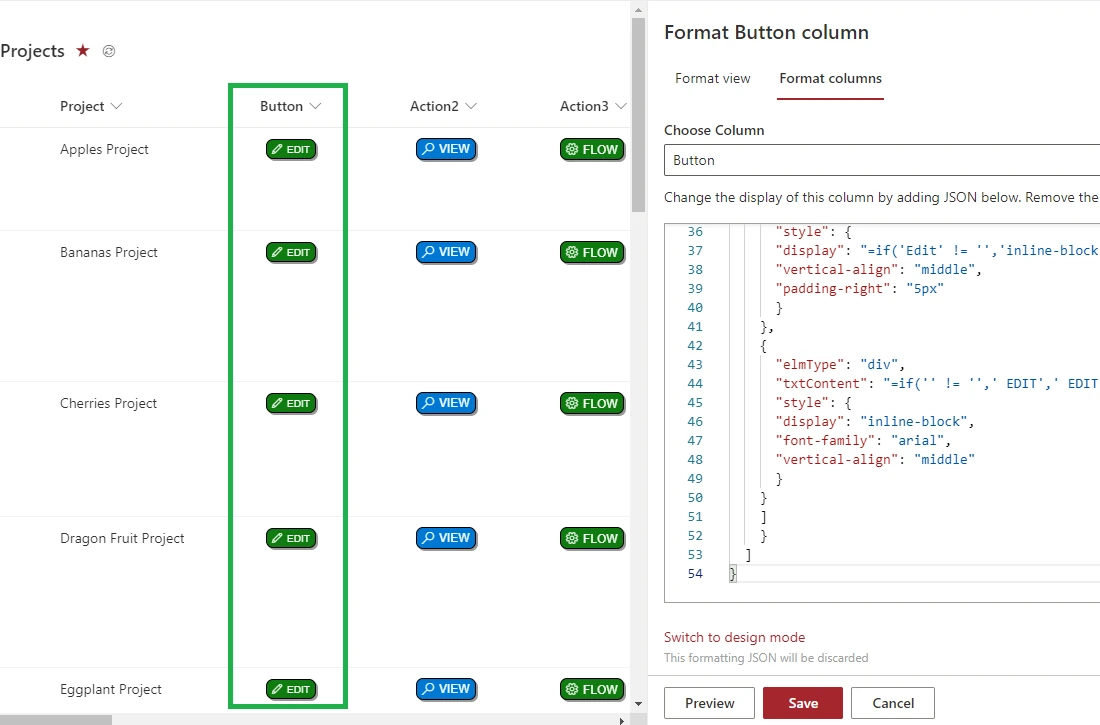
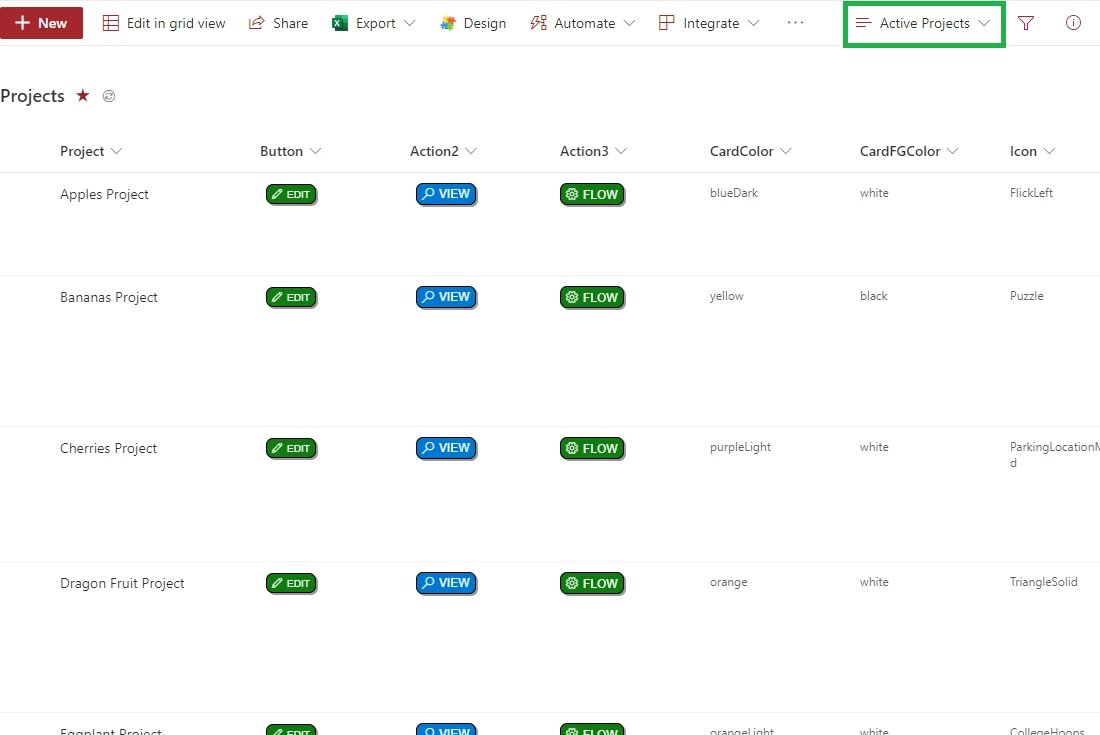
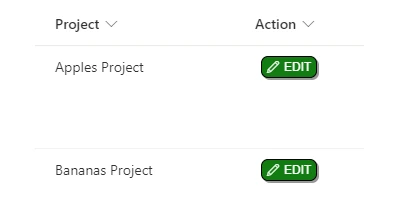
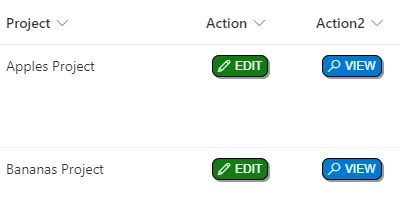
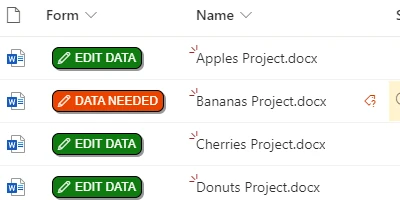
A simple edit button which takes the user directly to the edit form.
A simple view button which takes the user directly to the display form.
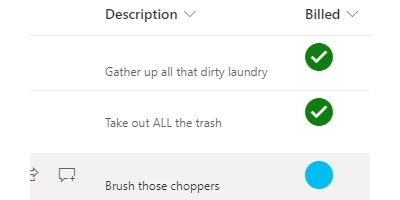
Display a Yes / No field as a checkbox which can be updated directly in the list view.
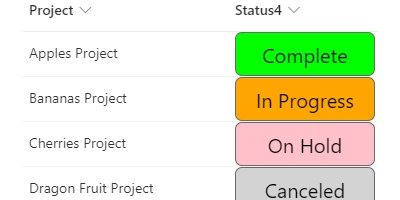
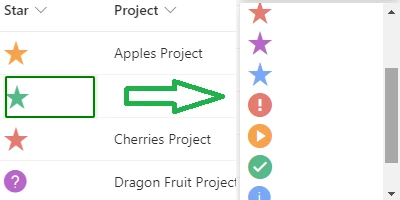
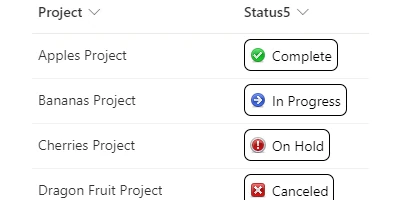
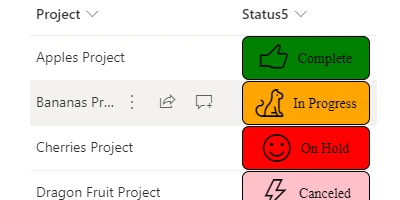
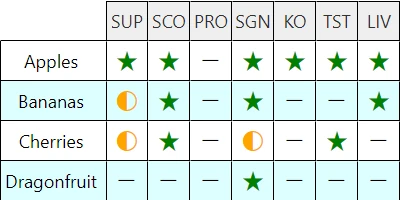
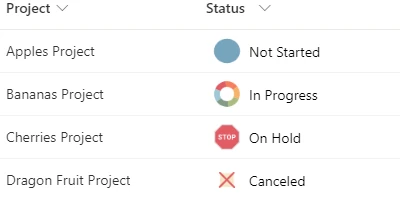
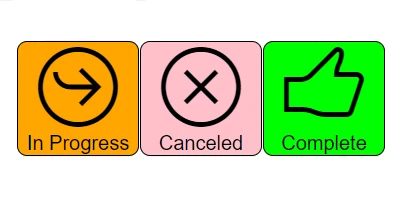
Pick your own status icons from hundreds of image choices to be displayed next to status values.
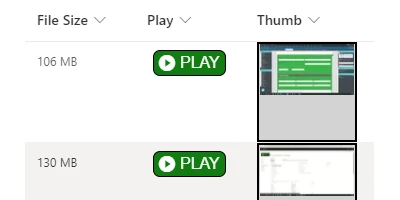
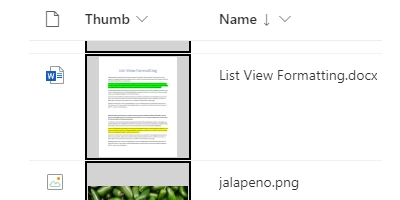
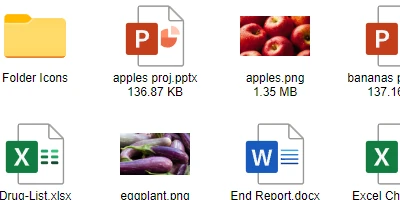
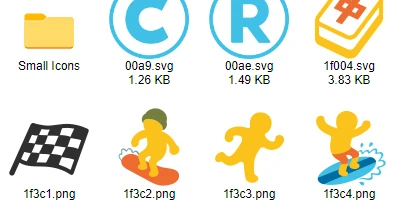
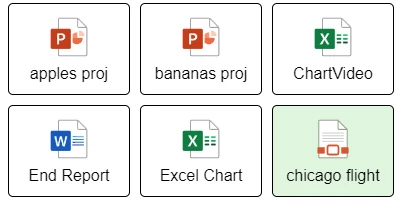
Display a thumbnail image of each file in a document library.
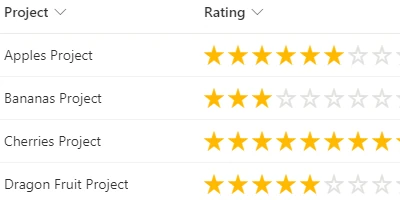
Show five stars or any number of other icons to indicate a rating for an item.
Place a button in each row which will trigger a "For a Selected Item" Power Automate flow.
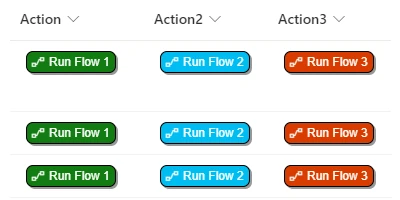
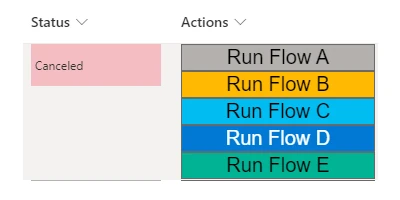
Place a stack of buttons in each row that will trigger "For a Selected Item" Power Automate flows.
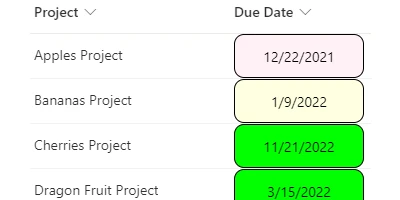
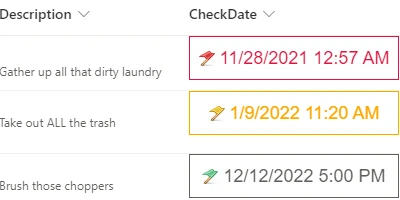
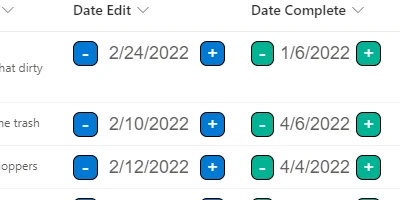
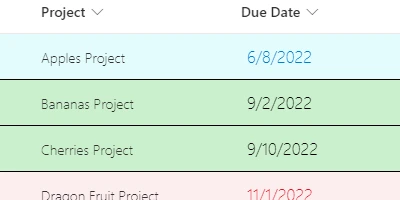
Show flag icons next to dates to indicate whether the date has passed, is today or is upcoming.
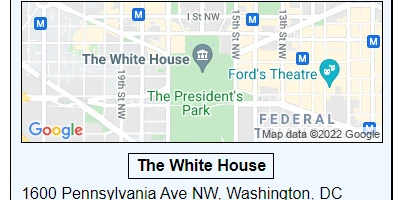
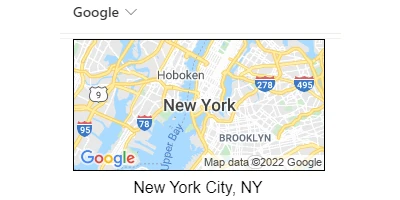
Display a Google Maps image and address according to location data in the record.
Pick your own status icons from thousands of Microsoft Fabric icon choices to be displayed next to status values.
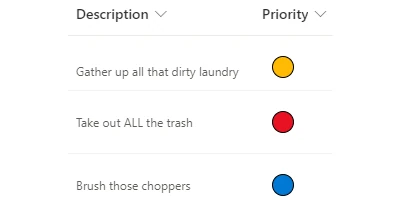
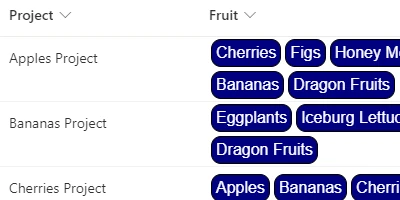
Display colored bubbles according to choice values. For example "Priority" with options of 1,2 or 3.
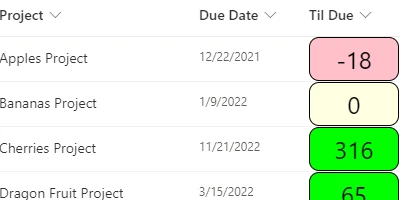
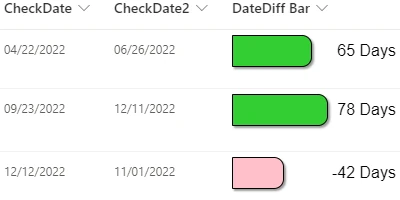
Show the numer of days between today and a date field. Includes highlighting based on whether the date has passed, is today or is upcoming.
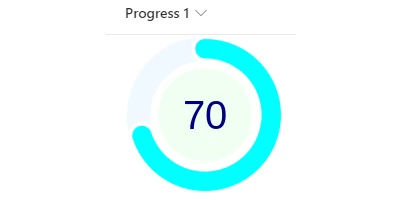
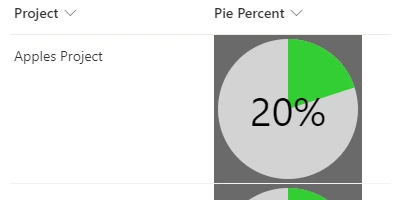
Show a pie chart style progress indicator to indicate percentage. Includes dynamic color settings according to value ranges.
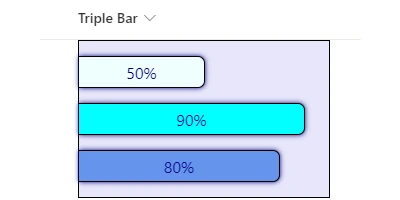
Show three progress indicator bars stacked on top of each other. Useful for consolidating progress bars into one column.
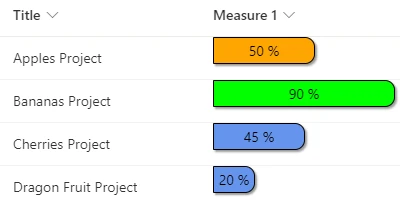
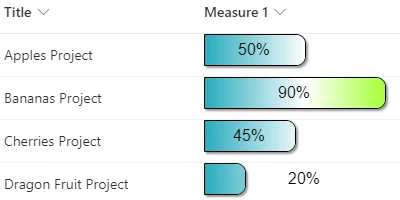
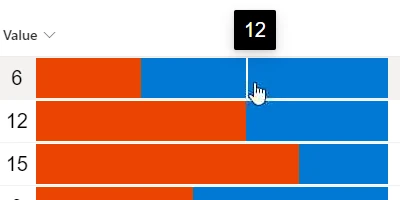
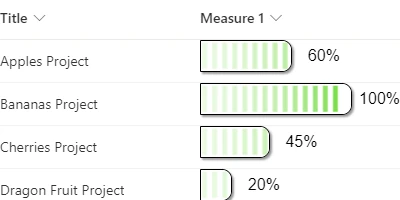
A progress indicator bar that changes colors according to the value in a number column. Useful to demonstrate critical thresholds.
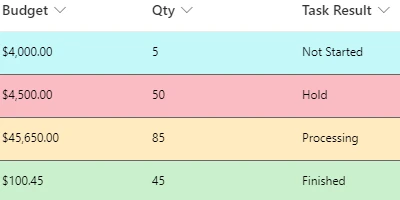
Customize choice fields to use colors and other custom formatting.
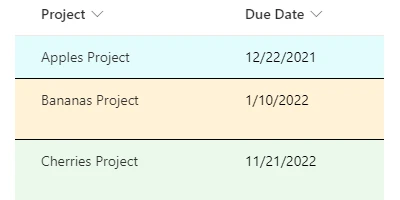
Highlight date values according to whether a date has passed, is today or is upcoming.
Format the overall display of list record rows including font, borders, colors and alternating row appearance.
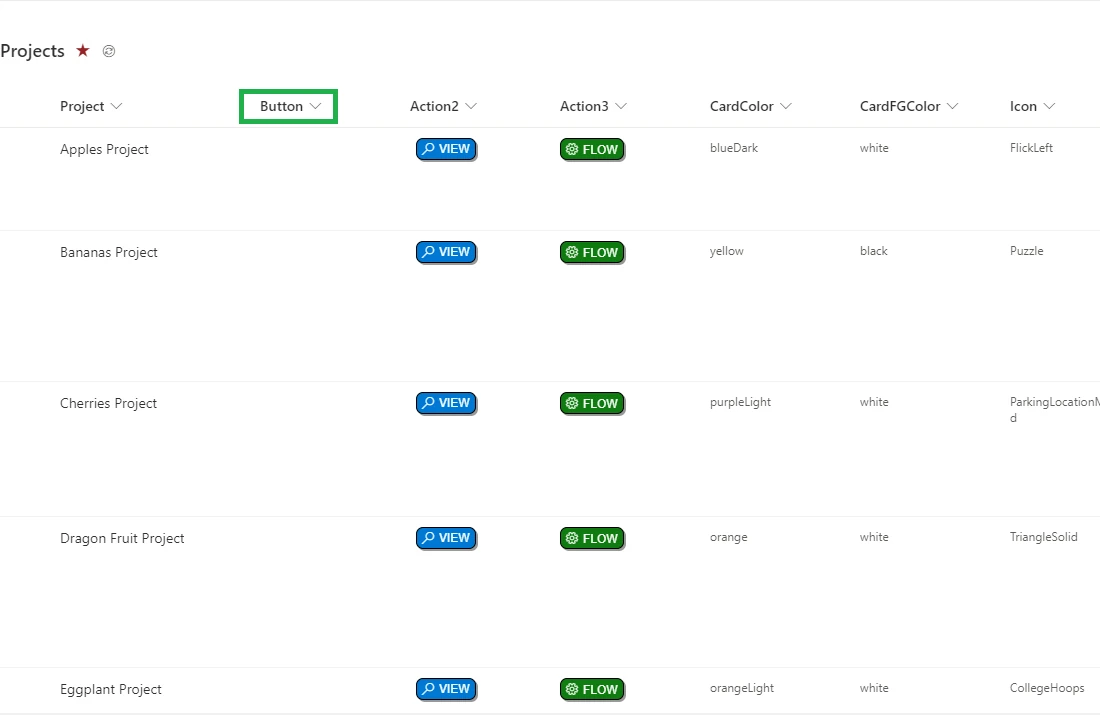
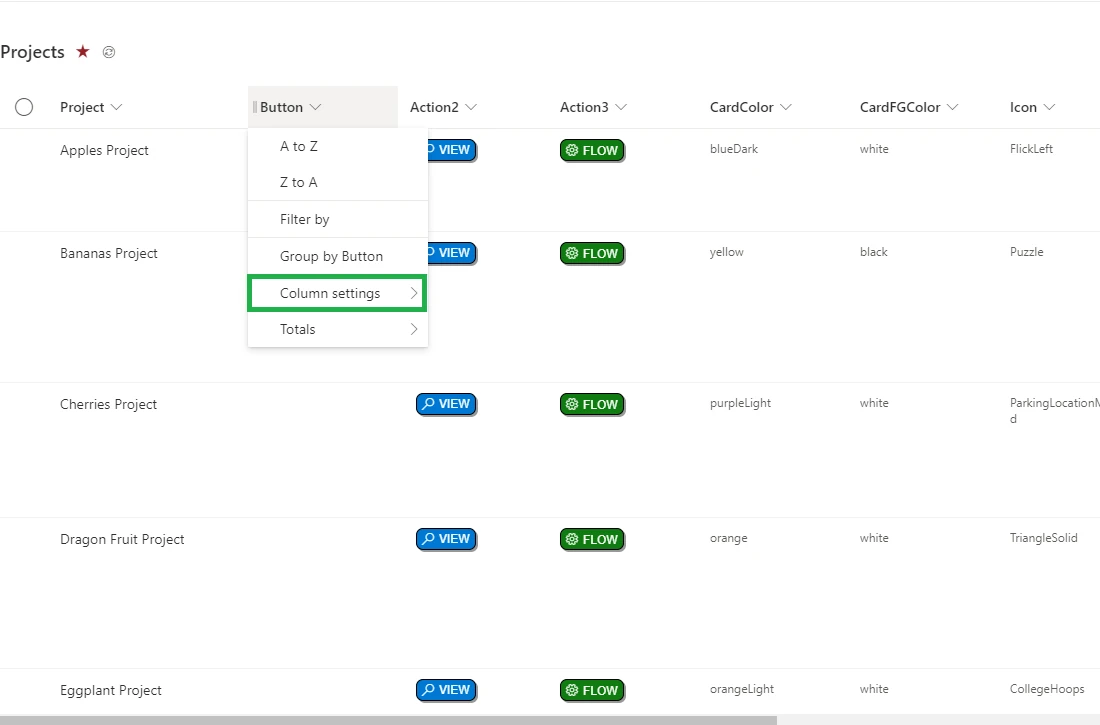
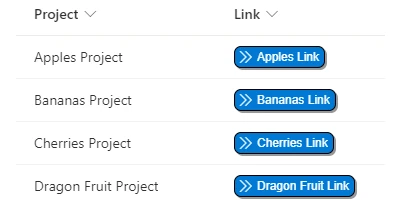
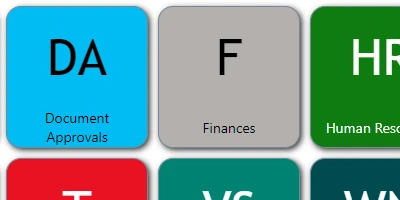
Create your own promoted links with complete customization including colors, fonts, icons, borders and hover appearance.
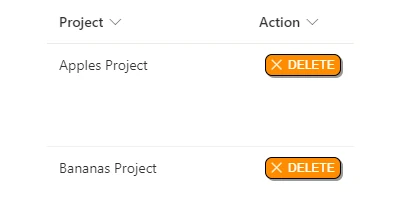
A simple delete button which triggers the dialog to delete the item.
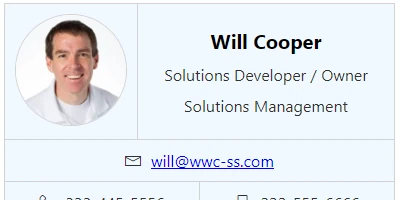
Show the user's profile picture from their user profile above the user name.
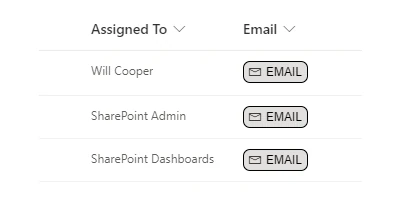
A button which starts a new email to the specified user.
Show a progress bar which uses a gradient colored background.
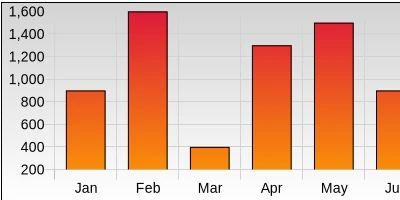
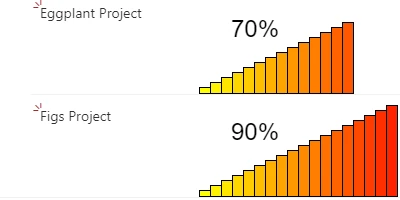
Display a bar chart with vertical columns displayed as an image from data in a single list record.
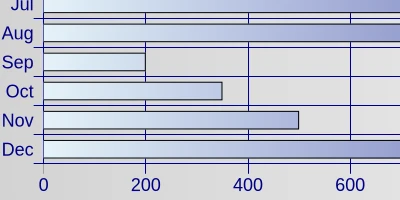
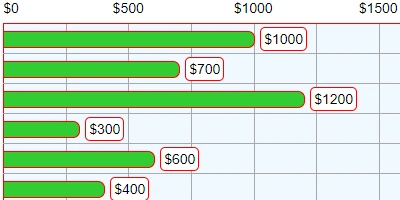
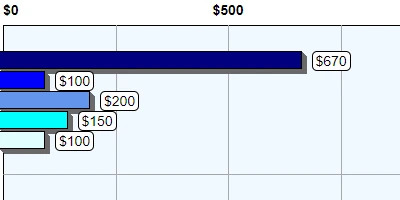
Display a bar chart with horizontal rows displayed as an image from data in a single list record.
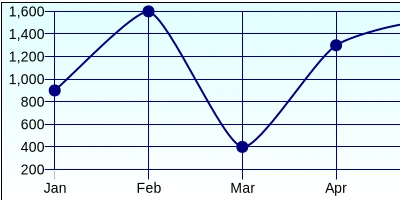
Display a line chart as an image from data in a single list record.
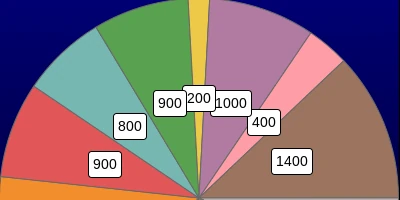
Display a pie chart as an image from data in a single list record. Includes legend and values.
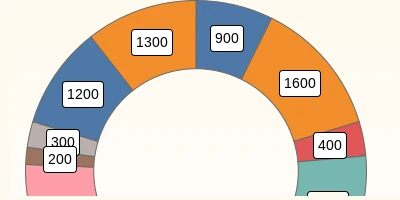
Display a donut chart as an image from data in a single list record. Includes legend and values.
Format a multi-select choice field to display user-friendly values.
Display a formatted Google Maps image in a card along with location information.
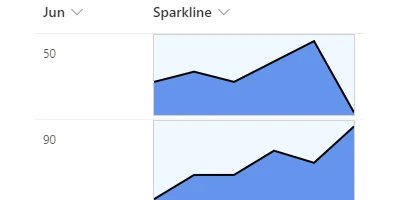
Show a mini line chart inline according to values in each list record. Useful for showing trend information.
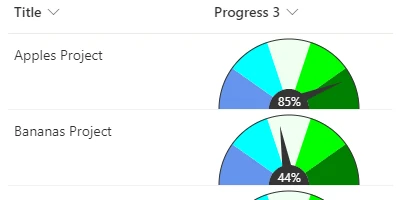
Show a radial gauge style progress indicator with many different look and feel configuration options.
Display a bar chart with horizontal rows displayed from data in multiple list records.
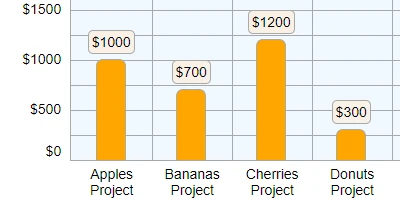
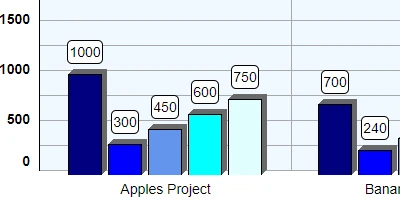
Display a bar chart with vertical columns displayed from data in multiple list records.
A simple button to open a hyperlink using a Hyperlink field.
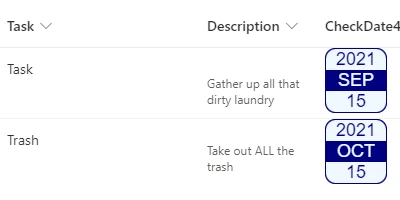
Show a date field formatted as a compact date box.
Highlight an entire row in a list according to values in a date column. Based on whether the date has passed, is today or is upcoming.
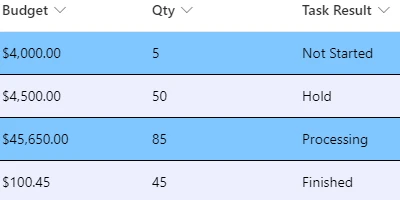
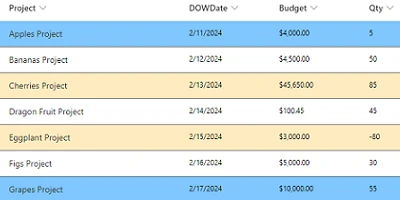
Highlight an entire row in a list according to values in a choice field or lookup field.
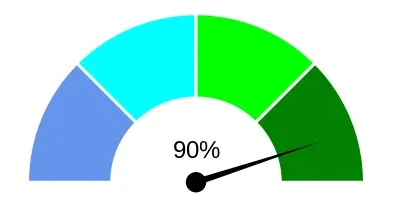
Show a car speedometer style indicator gauge in a semi-circle according to percentage values from 0% to 100%.
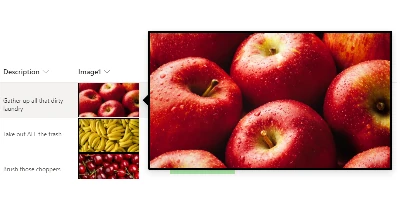
Shows a large version of an image when hovering over a small thumbnail image using either image field or hyperlink field.
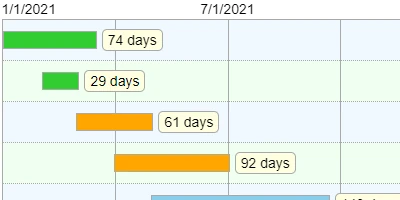
Display a highly configurable gantt chart displayed from data in multiple list records.
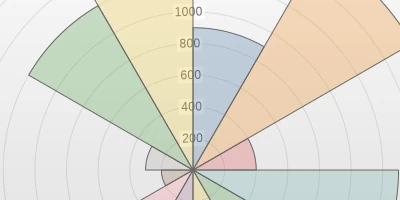
Display a special polar chart type as an image from data in a single list record.
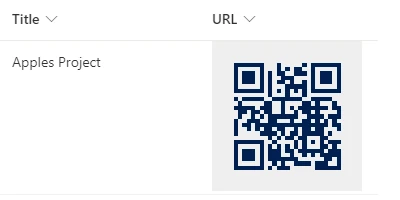
Displays a QR code using data such as a URL stored in a text field.
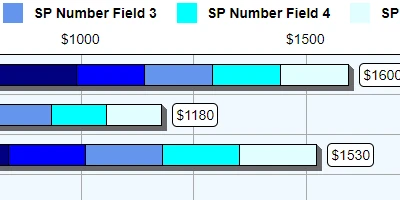
Display a stacked bar chart with horizontal rows displayed from data in multiple list records.
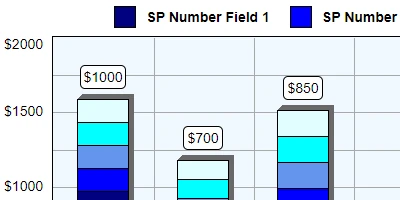
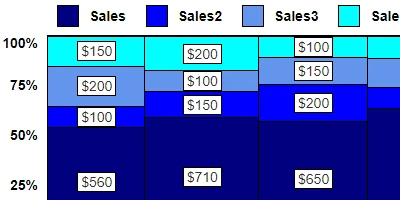
Display a stacked bar chart with vertical columns displayed from data in multiple list records.
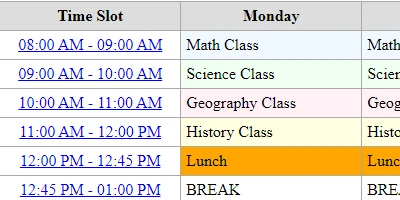
Show a weekly schedule grid used to demontrate a specific daily schedule including multiple time ranges.
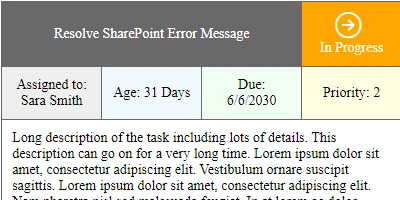
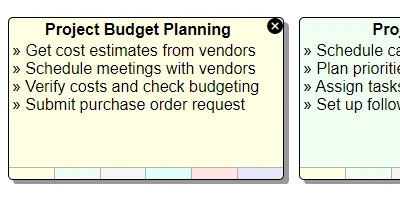
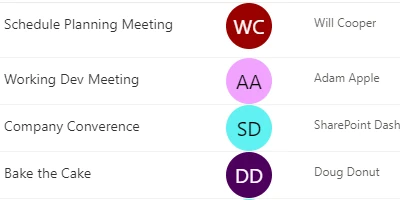
Format tasks into cards including key data including task title, status, priority, assigned to, due date and description.
Employee contact information cards including a profile picture for use as an organization directory.
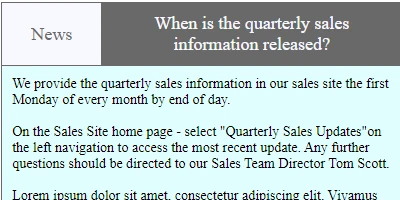
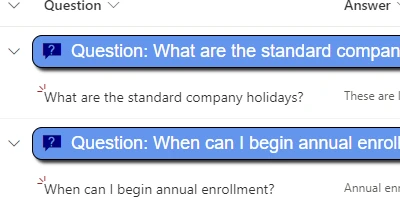
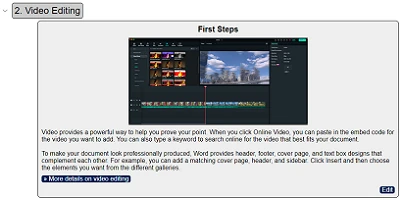
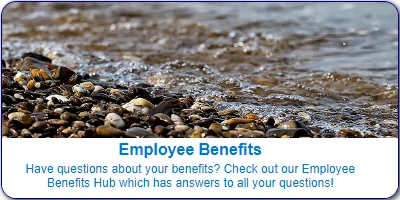
FAQ style information cards for use as wiki page or help guide.
A simple button to play the corresponding video in a library storing video files.
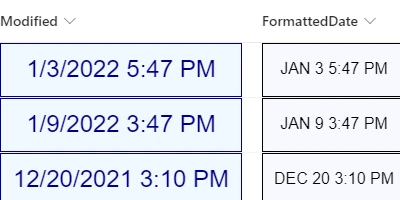
Format date information using multiple different user-friendly formatting options.
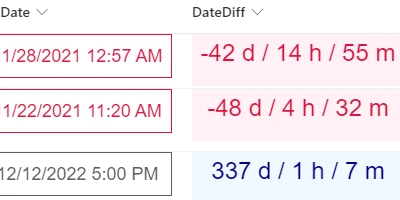
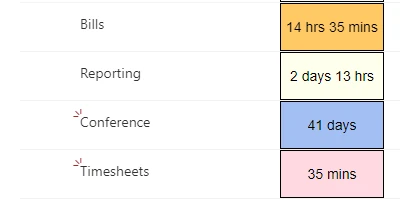
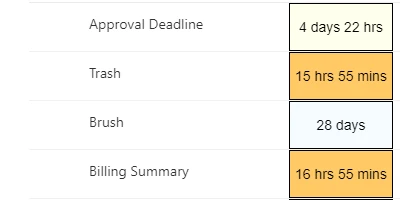
Show the precise difference in time between two dates using multiple different user-friendly formatting options.
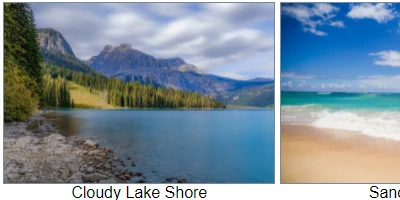
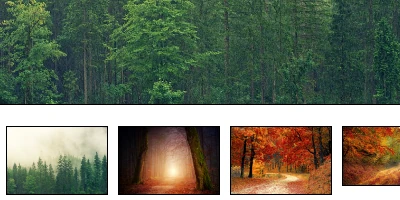
Display images stored in a library in an attractive image gallery format.
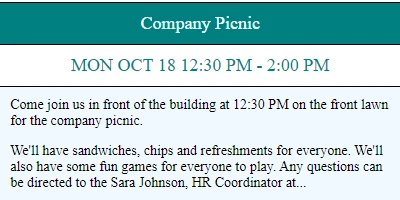
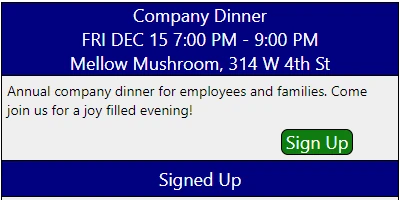
Display featured event information in cards for use on landing pages. A great way to call attention to key upcoming events.
Highlights the current user wherever their name appears in a person field in a list.
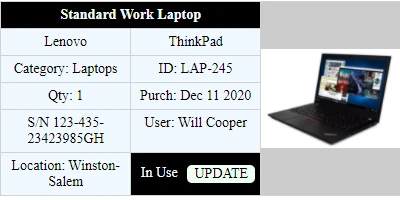
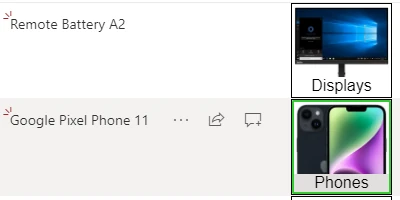
Asset tracking information displayed in eye catching cards including an image of each asset.
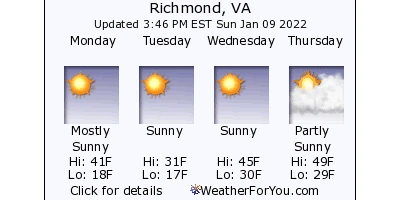
Show weather conditions and forecast information for USA based locations as a tile image.
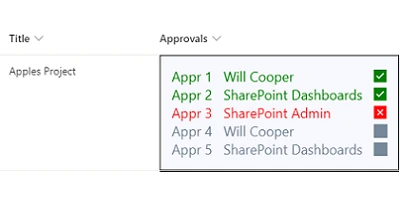
Display a summary of approvals for a list record. Rolls up approval information from several fields into a single column.
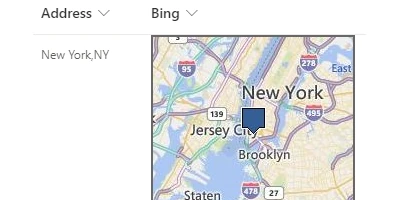
Show a formatted Bing map image according to a specified location.
Display a cluster of bars with horizontal rows displayed from data in multiple list records.
Display a cluster of bars with vertical columns displayed from data in multiple list records.
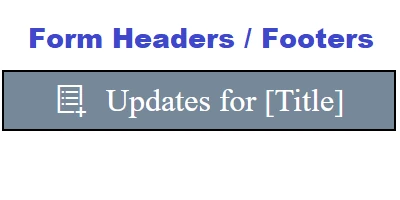
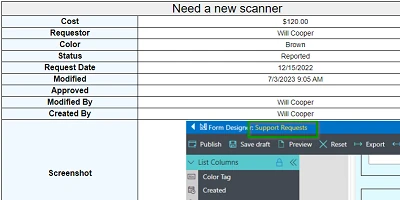
Format the form header and / or footer for the list form. Includes several different formatting options.
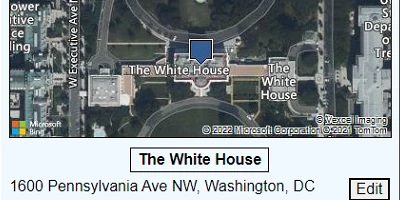
Show a formatted Bing map image along with location information according to a specified location in a formatted card.
Turn on the inline edit functionality for most field types including: text, number, date, choice, person and lookup.
A simple button to open the SharePoint list record context menu (instead of having to click on "...")
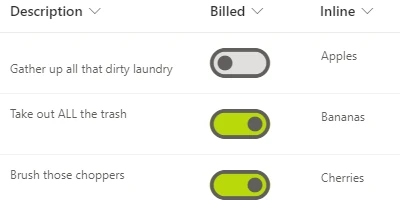
Display a simple toggle button for use with a yes / no field. Configure size and color options in many ways.
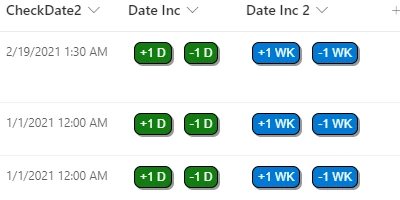
Add buttons adjacent to a date field to allow the date / time value to be incremented or decremented.
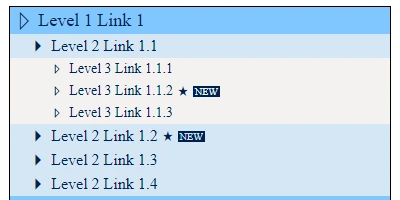
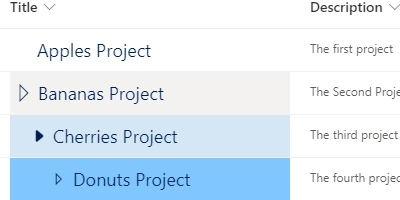
Formats a list into an indented navigation tree. Useful for situations that require a long list of hyperlinks.
A date input formatting option that allows inline edit and date increment / decrement using buttons.
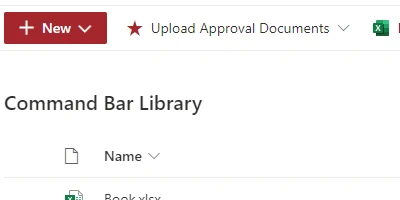
Configure list and library command bar options to be shown or hidden. Optionally customize text and icons for commands.
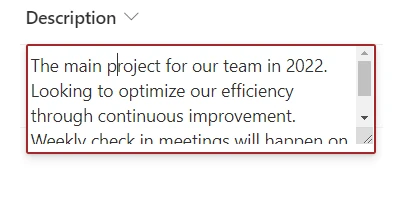
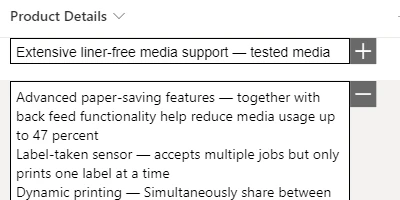
Formatting and configuration options for multiline plain text fields. Optionally allows inline edit and scrolling.
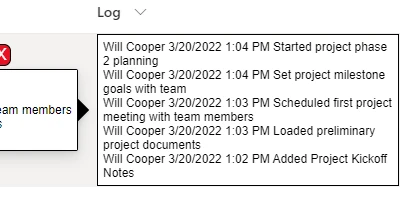
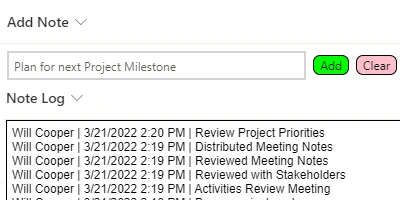
Input logging tool which allows for notes to be appended to a multiline plain text logging field.
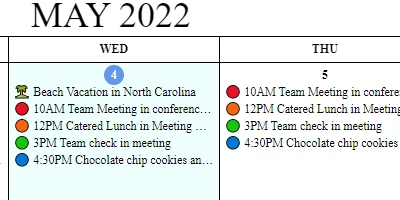
A sophisticated and full-featured calendar template which includes many more features than the standard SharePoint calendar view.
Display a flow chart as an image automatically rendered based on text information. Makes use of open source Graphviz platform.
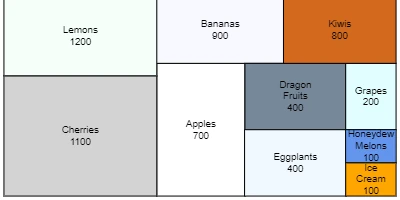
Displays a proportional area chart as an image using data similar to a pie chart. Renders data in boxes proportional to the numeric data.
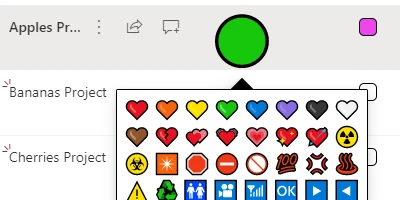
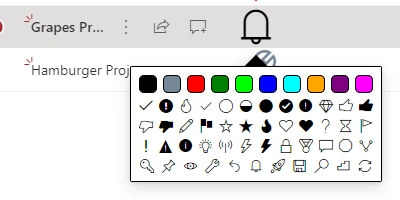
Allow users to pick an emoji icon using a custom icon picker.
Allow users to pick an Microsoft fabric icon using a custom icon picker.
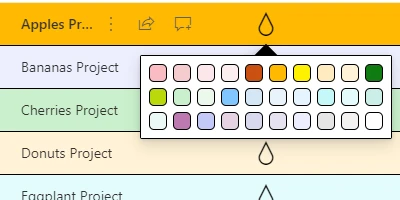
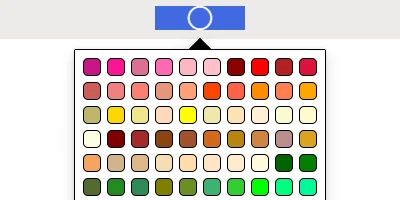
Allow users to pick a custom background color use a custom color picker.
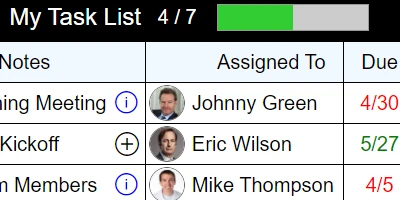
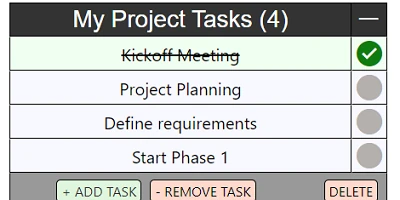
Displays dynamic tasks lists using inline grid style entry. Automatically tracks and formats according to user updates.
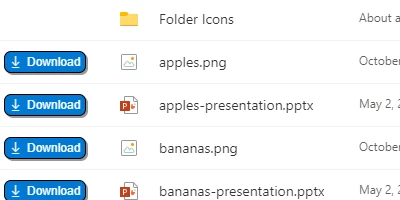
A simple download button for use in document libraries.
A slider style input for setting numberic values based on customizable number range.
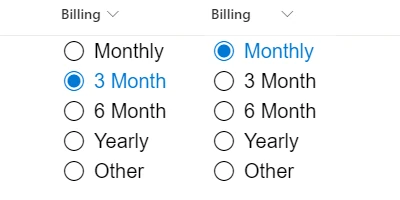
Formats a choice field (using a single value) into interactive radio buttons.
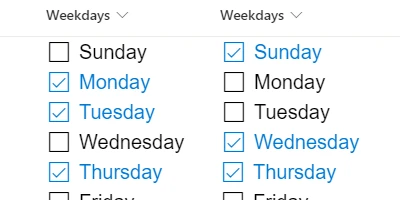
Formats a choice field (using multiple values) into interactive checkboxes.
Create sticky notes with six different background color options tiled across the page.
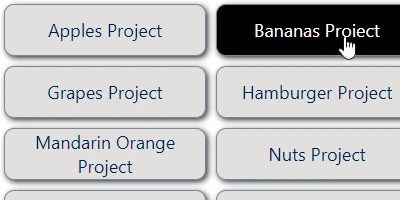
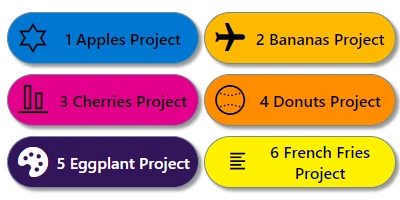
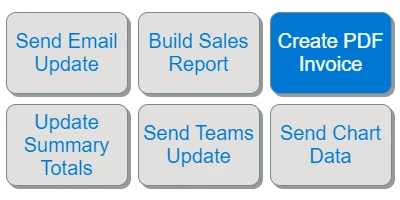
Create a grid of navigation buttons using many different look and feel configuration options.
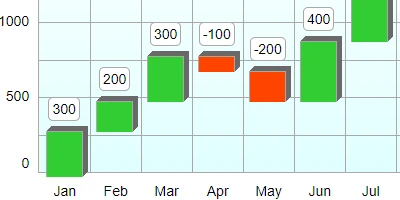
Display a waterfall chart show vertical columns of data demonstrating incremental changes over time.
Display links to YouTube videos in cards including automatic display of YouTube preview images.
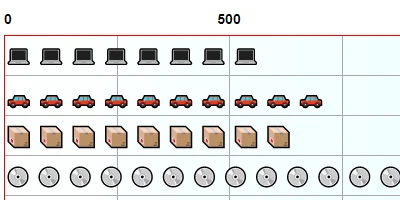
Display a horizontal bar chart that uses emoji images instead of bars for a unique visual aesthetic.
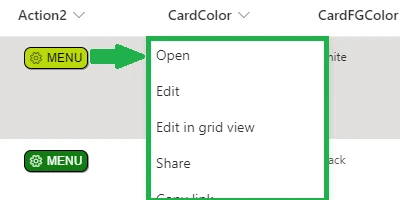
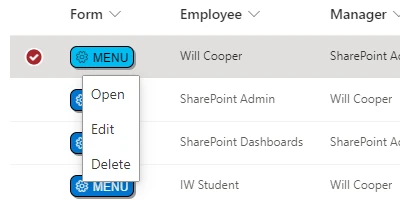
Show a simple menu button with popular open, edit and delete options rolled up into one menu.
Display the visually interesting Marimekko stle chart using special charting data.
Show a picture slideshow rendered using a list with a series of images.
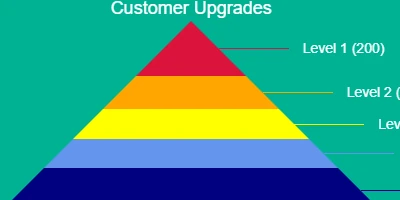
Display a pyramid style chart useful in situations where there is a series of increasingly smaller values.
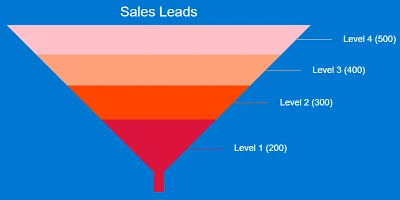
Display a funnel style chart useful in situations where there is a series of increasingly smaller values.
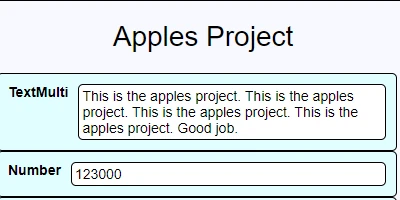
Build a fully customized card template which includes options for a large number of fields.
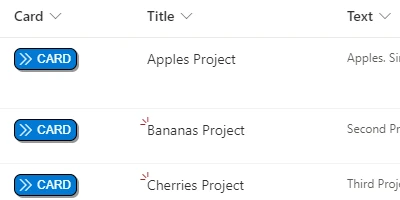
Use in combination with the custom cards template which links from a standard list view to the custom card view.
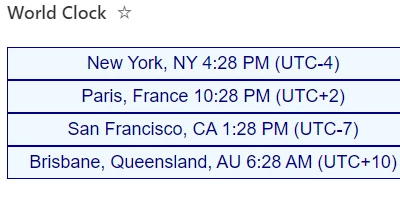
Show a series of locations from anywhere in the world with correct local time diplayed for each location.
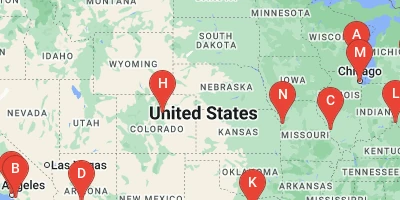
Display a Google pushpins style map which includes pushpins for many locations displayed on a single map along with a location list.
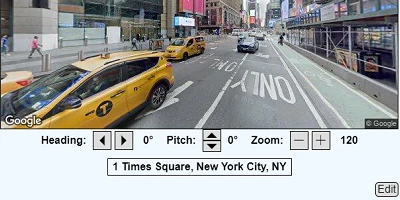
Display Google streetview images in an interactive interface allowing users to adjust the camera view.
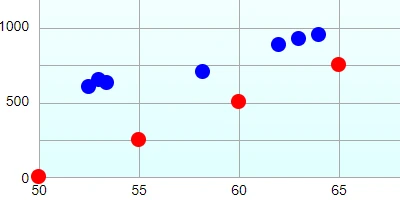
Display a scatter plot chart according to X and Y scale values using multiple list records.
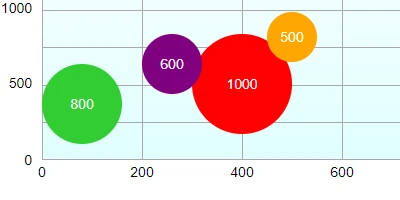
Display a bubble chart using data based on X, Y and Z scale values using multiple list records.
Highlight rows of list records insides of a set date range. Useful when looking a window of dates.
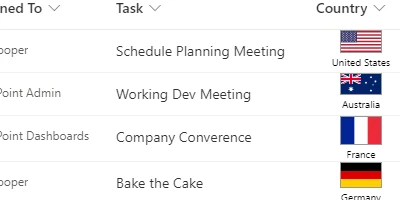
Show a country flag above a selected country in a choice field.
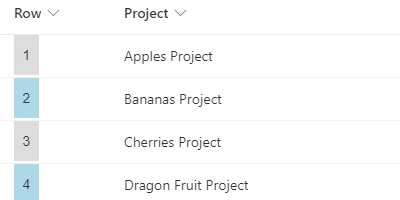
Add line numbering to your list. Useful as a reference point and in counting records.
Show an animated progress bar as an eye catching visualization of progress data.
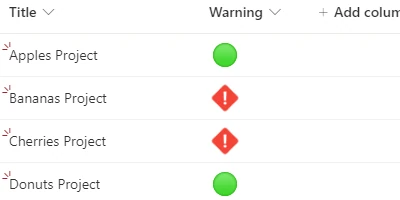
Add an eye catching animated warning to help critical records stand out in a list.
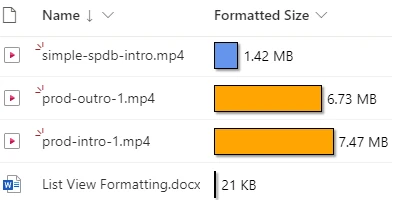
Include file size bars to easily compare file sizes in a libary.
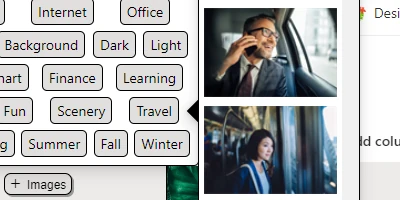
Pick from Microsoft provided images using interactive menus and thumbnail images.
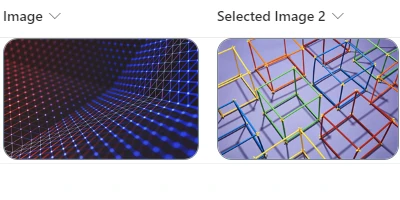
Format images to a specific size in the list view.
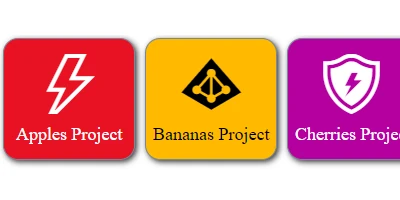
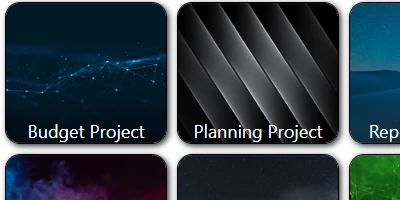
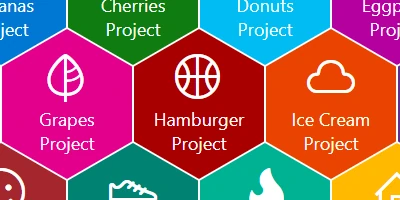
Build a tile image link style navigation that is visually appealing to users.
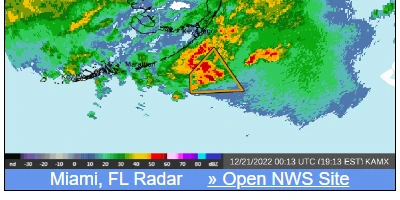
Weather radar for USA based locations throughout the country.
Format the group header to set up an attactive accordion style interface.
Show the initials of the selected user using unique colors for each of the letters from A to Z.
Build a tile links navigation that shows large letter initials according to the words in the tile link.
Display a colored bar indicating the difference between two dates.
Show a tiles style interface in a library for a more aesthetically appealing user experience.
Show a library of images as thumbnails along with the file name and size.
Show a meter style indicator to demonstrate progress using custom color configuration.
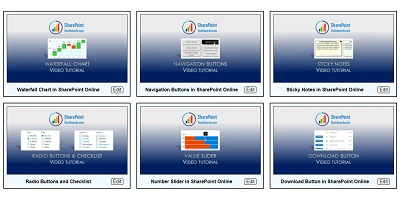
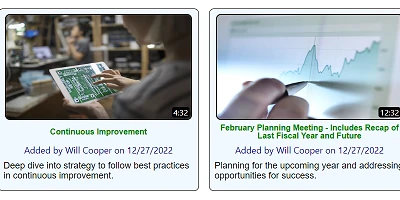
Display a library of videos as attractive YouTube style cards with an image preview, video details and time information.
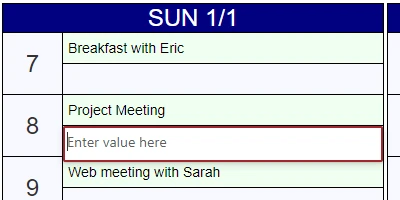
Show a day planner style calendar for entering granular scheduling information accounting for each of the hours of the day.
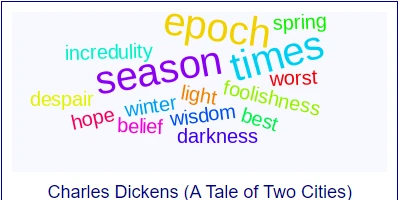
Display a special work cloud image based on the value in a multiline plain text field.
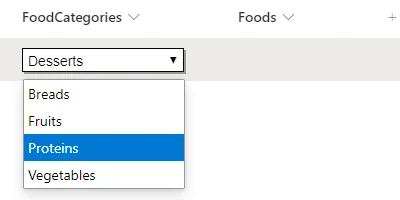
Show a dropdown style input for a choice field.
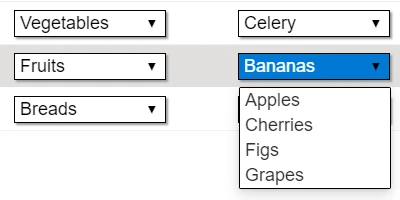
Create a cascading dropdown in which the values in one dropdown are filtered according to the values in the first dropdown.
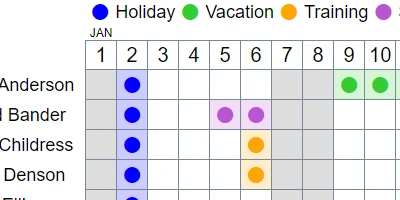
Create a customized leave tracking calendar in which a grid is showing to demonstrate when workers are in and out.
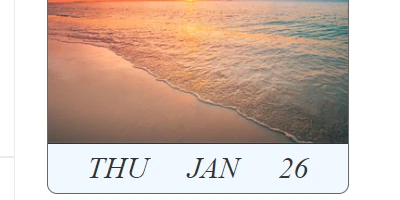
An atttractive "page-a-day" calendar which display a unique image for every day of the year.
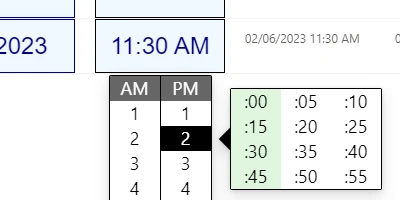
A custom time input field used to set the time for a date / time field.
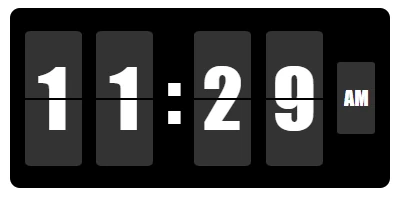
Display a nostalgic looking flip clock with the current time.
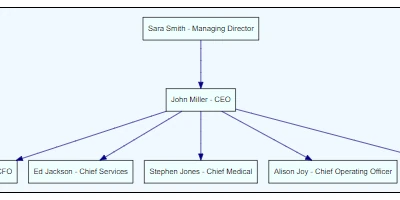
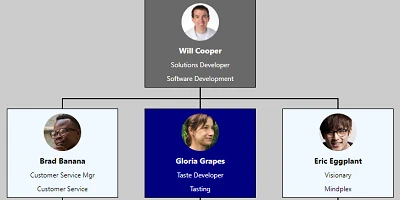
Create a complete org chart diagram including employee pictures, job title, department in a full heirarchy.
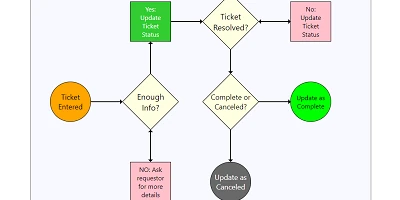
Create a dynamic flow chart useful in process diagrams to demonstrate a specific work process.
Display a custom color picker useful in combination with other templates which require a color field.
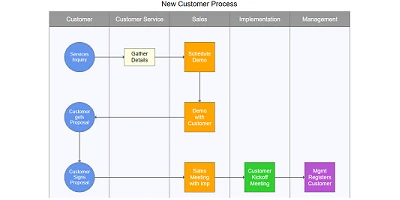
Create a swim lanes process diagram to demonstrate processes between departments.
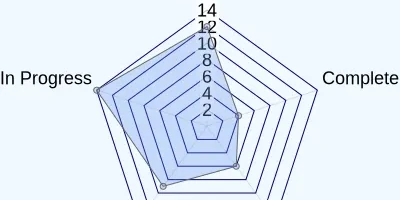
Create a special radar chart rendered as an image based on data in a single list record.
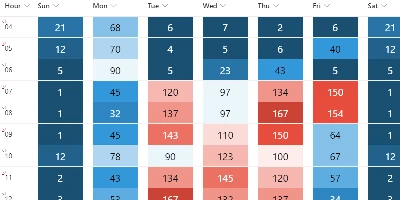
Display a gradient heat map based on numeric data typically using blue as a low value and red as a high value.
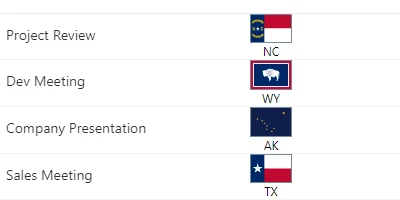
Display USA state flags based on values in a choice field holding state values.
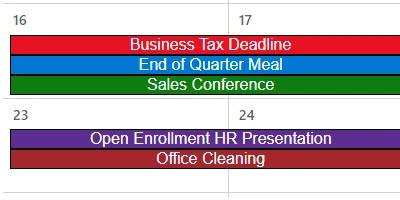
Add background color highlighting in an out-of-the-box SharePoint calendar list view.
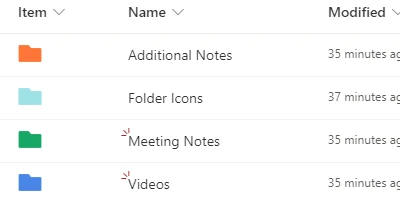
Add colored folders icons to your library to help differentiate between different folder categories.
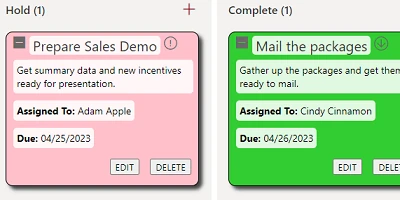
Set up a special formatted "drag and drop" style task board with configurable task cards.
Expandable accordion style multiline text control. Useful for dynamically opening and closing detailed descriptions and notes.
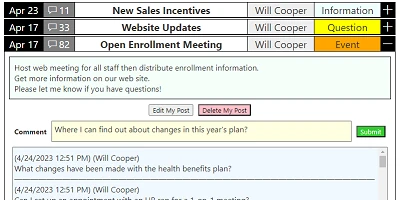
Add interactive discussion boards to SharePoint. User can post topics and collect feedback and conversation from other users.
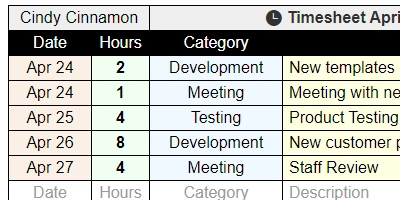
A grid style timesheet report template for reporting hours.
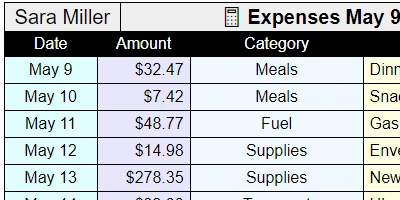
A grid style expenses report template for reporting expenses.
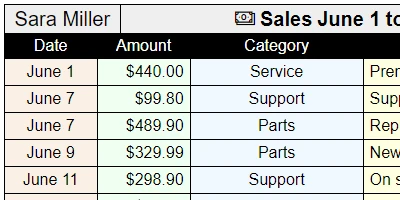
A grid style sales report template for reporting sales.
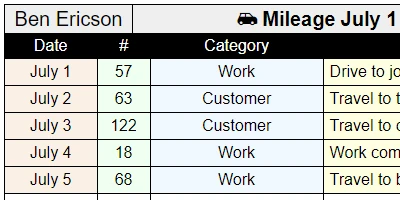
A grid style mileage report template for reporting mileage.
Custom bullet point formatting including icon configuration and indenting.
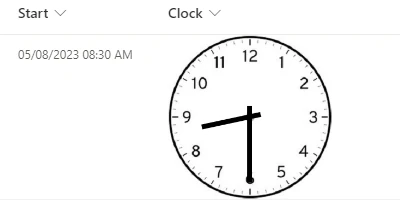
Show an analog clock according to date / time field time information.
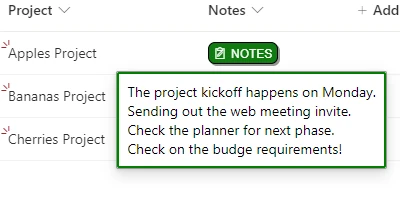
Display an interactive pop-up notes window for use with a multiline plain text field.
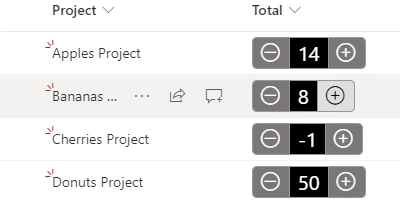
Add a number spinner style input field for incrementing / decrementing number fields.
Add a custom grid style print template for use in printing sharepoint lists.
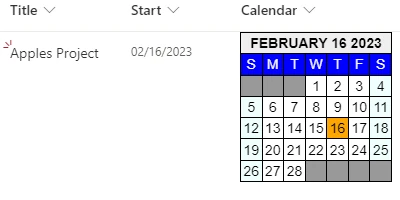
Show a calendar month box for visualizing date / time field information.
Add colored stars and icons to tag list items and documents according the key data.
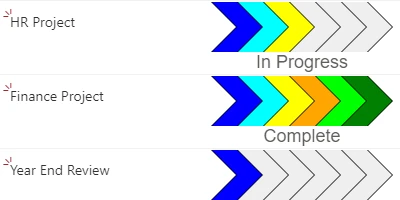
Add a chevron shape style progress indicator according to process stages.
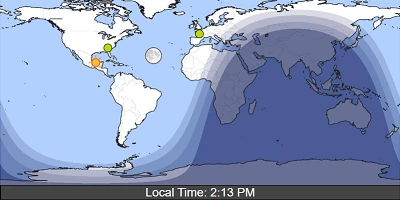
Create a world locations map with your own custom pushpin locations and current time information.
A simple button to open the document properties form.
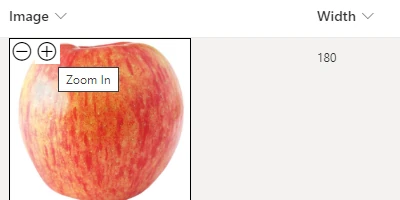
Add zoom in / zoom out functionality to images in your list.
Format list record data into a grid specifically for the purpose of printing information.
Create a grid of pill style navigation links to be displayed in a grid.
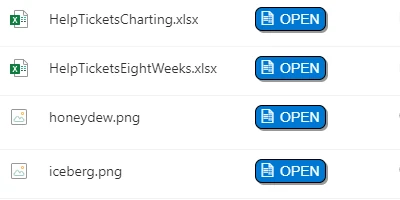
Add a simple button used to open documents in a library.
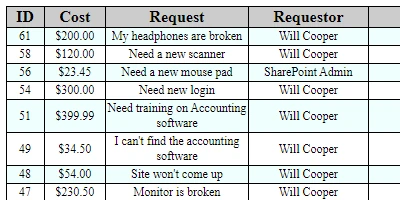
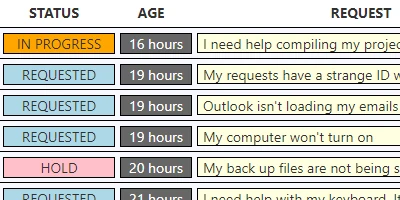
Add a custom help ticket grid used to highlight key information on support tickets.
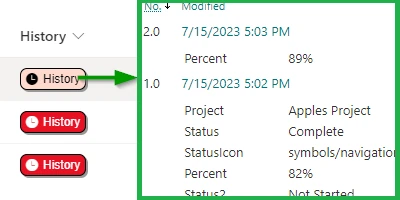
Add a simple button which opens the history of a specific list item.
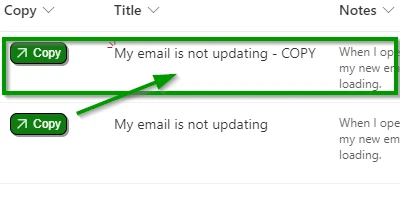
Add a simple button to trigger a Power Automate flow which copies a list record.
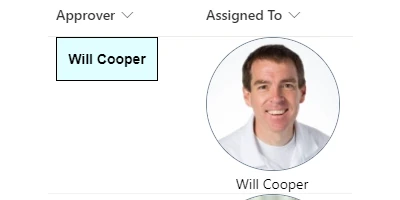
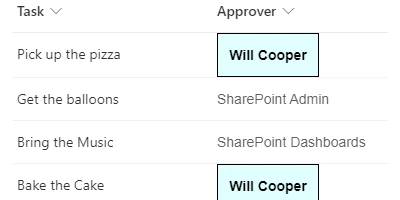
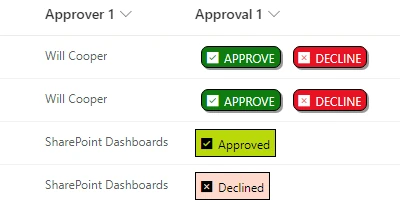
Add approval buttons which appear in the list view for a designated approver.
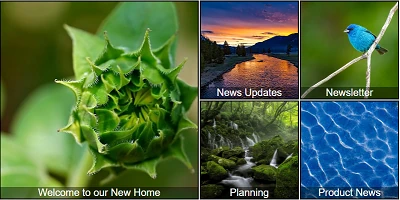
Add a hero style navigation in which boxes can have varying sizes.
Add a stairstep style progress indicator in which progressively higher bars appear from left to right.
Add a dynamic date aging indicator that shows how much time has passed since a date / time value.
Add a dynamic date countdown indicator that shows how much time is left until a date / time value.
A simple text field formatting template.
Add a visually interesting hex grid style navigation.
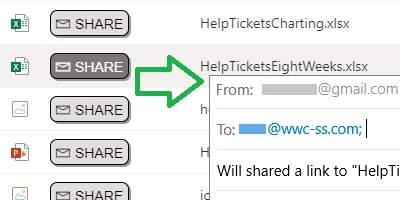
Add a share button to share a link to a designated list record or document.
Create an interactive status bar in a narrow grid style format.
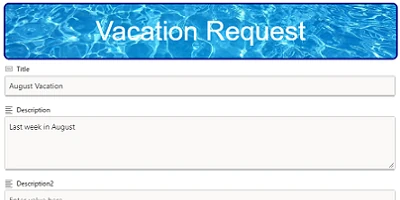
Format the header of a form with an image background and other styling.
Add simple checklists that can be updated directly in the list view.
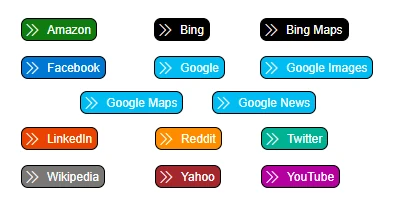
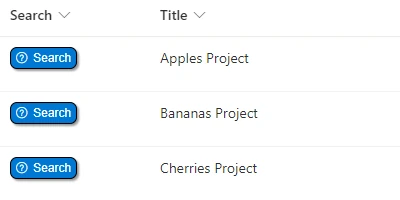
Add a button which which search the web for information based on a list record.
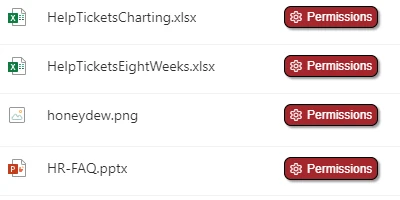
Add a button which links to permissions information for a list item or document.
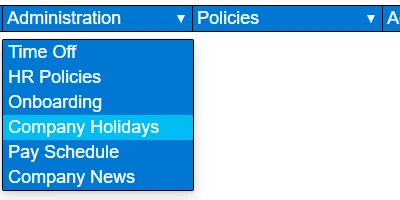
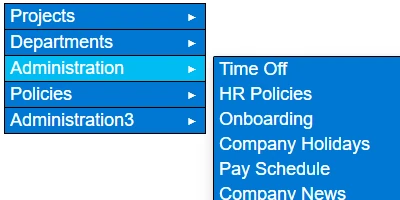
Add dropdown navigation menus which can be placed on pages using the list web part.
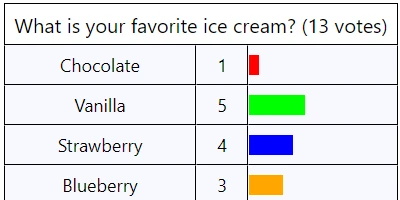
Add a voting web part to a page which allows users to vote on topics that interest them.
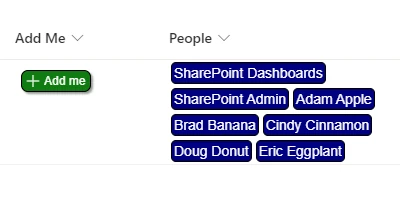
Apply formatting to a multi person person field to show all the names neatly adjusted to look how you want.
Add a button which allows users to add themselves to the list of people in a person field.
Convert a choice column into a list of choices which includes images to help demonstrate each option.
Create a fly out navigation menu based on a list of values in hyperlink fields.
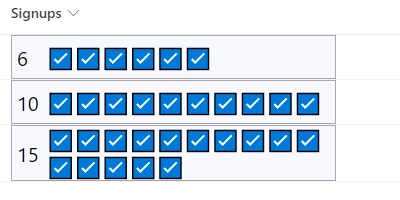
Create an event signup where users can add themselves with a simple button click.
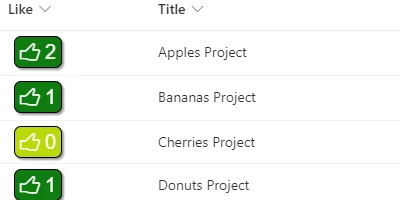
Add a like button for users to indicate which items they like.
Add animated status icons to make information more eye catching and engaging.
Create an accordion style Wiki / FAQ section with custom formatting.
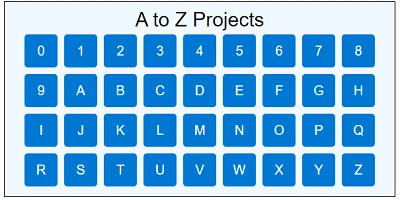
Create an A to Z filter navigation which allows users to jump to filtered list records.
Create a jumbo style status indicator using Microsoft fabric icons.
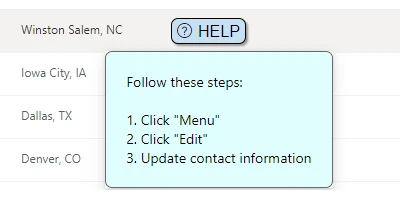
Add a help window which provide custom information to help guide users on what to do.
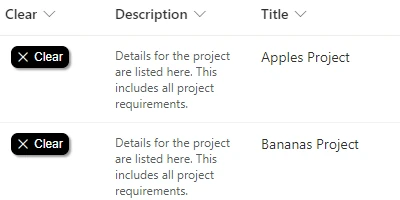
Add a simple clear button to clear the values of one or more fields in a list record.
Add a simple search button which searches for other list records matching the value in the source record.
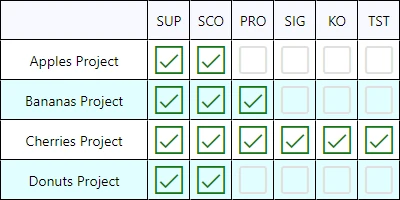
Create an interactive check board to check off items in a compact easy to understand grid.
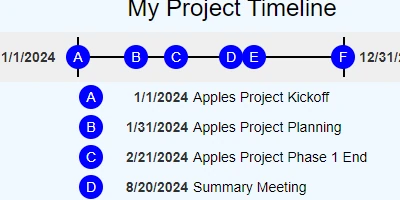
Add a timeline for projects or other key data to visualize events over a custom timeline.
Add a pictogram style progress indicator that uses emoji icons in place of a progress bar.
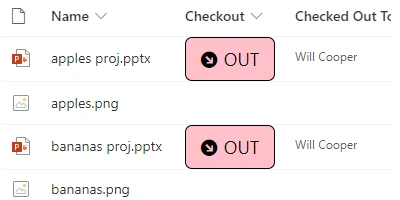
Indicate checkout status for files in a library in an eye catching format.
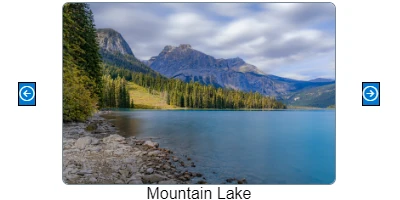
Add an interactive slideshow picture viewer which allows users to browse a series of images.
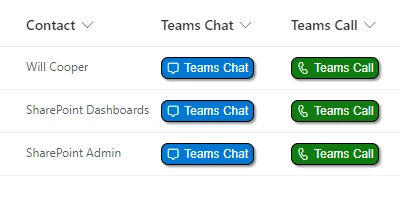
Add a button to link to a Microsoft Teams Chat or Call.
Add row highlighting based on the day of the week. Useful to differentiate between work days and weekends.
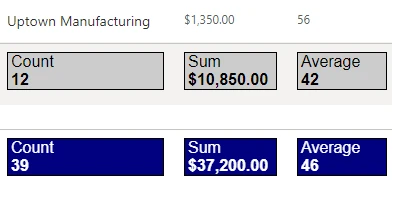
Apply group footer formatting. Useful in views with aggregated totals for groups.
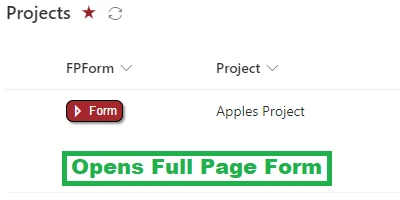
Add a button which links to a full page list form for a list record.
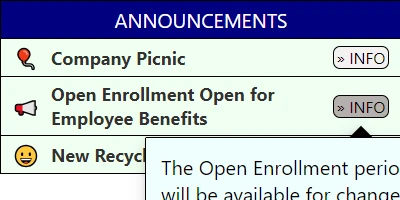
Add a seres of important announcements which can be highlighted on pages using the list web part.
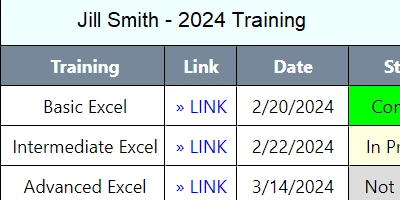
Track training progress for users with this interactive training tracking checklist that can be updated from the list view.
Create your own tests and quizzes in SharePoint using this comprehensive testing template system.
Display large tile links that feature custom images in a large display in additiona to a detailed description.
Showcase featured documents in a tile navigation style interface.
Add links to trigger Power Automate flows from a button switchboard.
Add a series of links formatted into circles with image backgrounds.
Add a series of featured events which are displayed dymanically on pages with custom formatting including images and detailed description.
Add an inline pie chart to your list view.
Add an inline donut chart to your list view.
Choose from many different barcode formatting systems to render numeric codes as barcodes.
Toggle to Microsoft Lists from SharePoint and back using simple buttons.
Add an inline bar chart displayed in vertical columns to your list view.
Add an inline bar chart displayed in horizontal rows to your list view.
Add an inline line chart to your list view.
Conditionally show or hide data in columns that should be visible only to admins.
Allow assets or people to be marked as checked in our checked out on a visually appealing status board.
|
||||||||||||||||||||||||||||||||||||||||||||||||||||||||||||||||||||||||||||||||||||||||||||||||||||||||||||||||||||||||||||||||||||||||||||||||||||||||||||||||||||||||||||||||||||||||||||||||||||||||||||||||||||||||||||||||||||||||||||||||||||